ATAC + RNA multi-omics Quality Control Report Documentation
This document provides a structured interpretation of quality-control (QC) metrics reported by SeekArcTools for single-cell multi-omics data (scATAC-seq + scRNA-seq). For each metric, it explains the definition, how it is computed, and how to interpret it, to help evaluate sequencing/library quality, cell-calling reliability, and the usability of chromatin accessibility (ATAC) and transcription (RNA) signals for downstream analyses.
The report is organized into three sections: Joint, RNA, and ATAC.
Joint Metrics
This section summarizes the most critical joint-scale metrics computed on barcodes that pass QC in both RNA and ATAC and can be matched one-to-one, reflecting the overall size and information content of the joint dataset as well as the global morphology of joint cell calling.
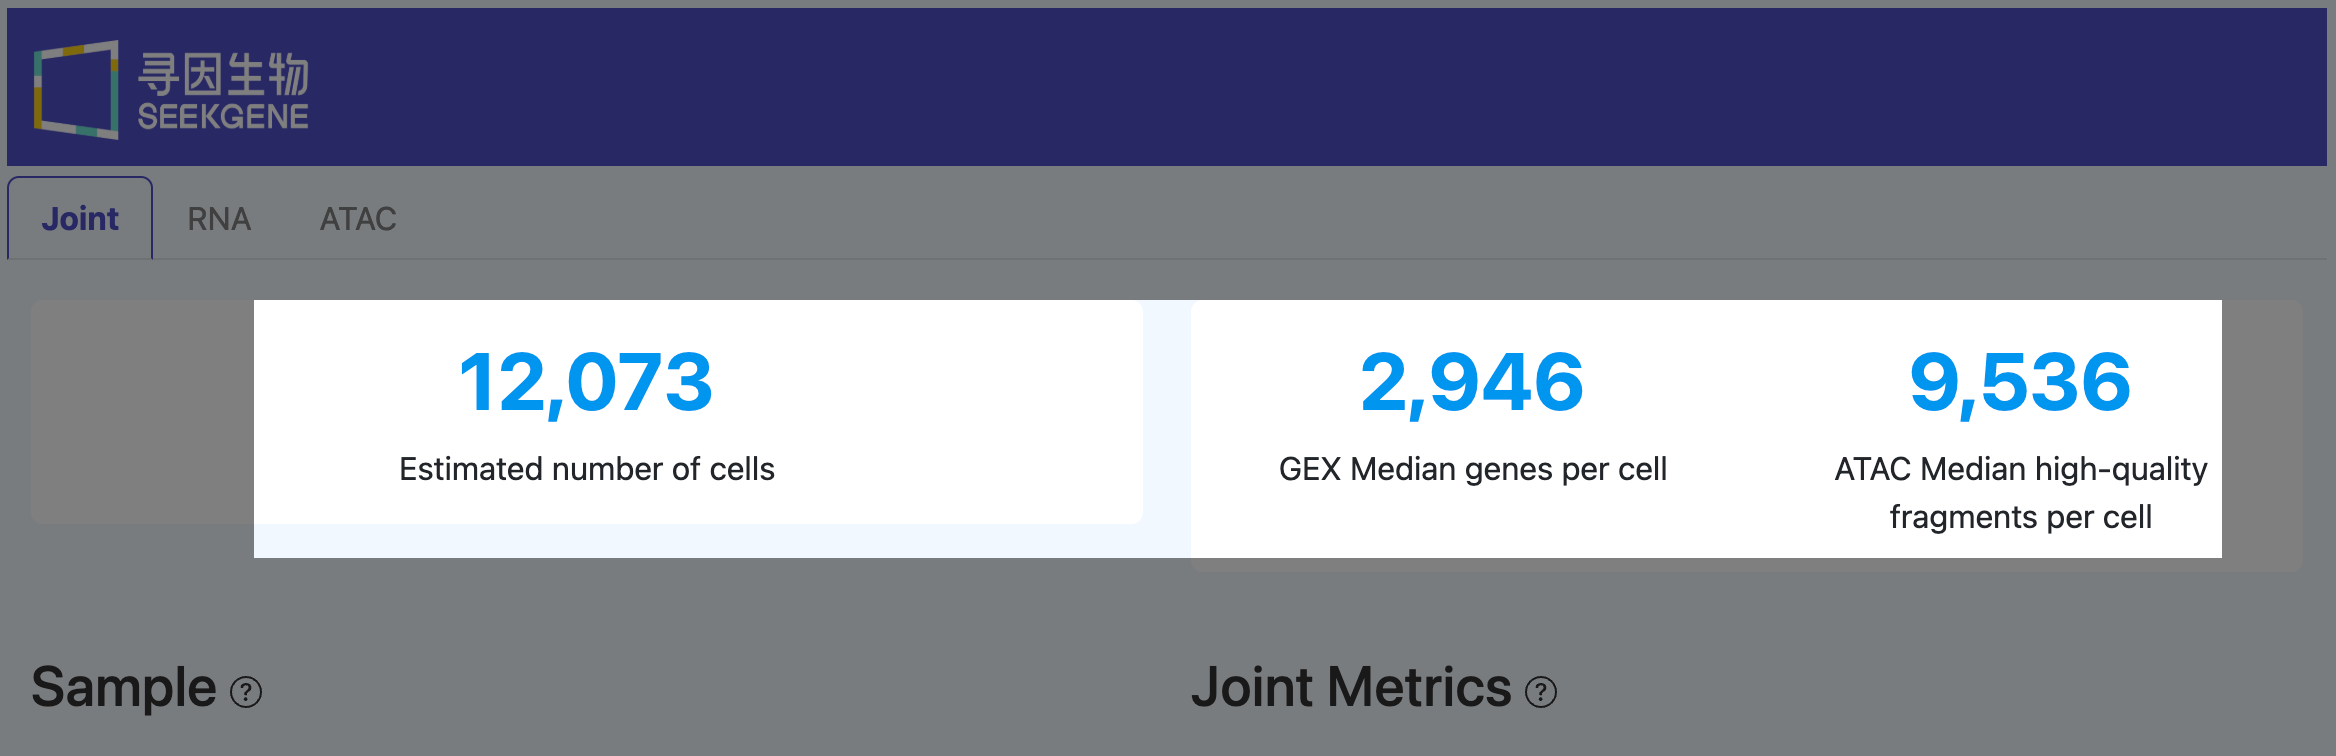
Estimated number of cells (Joint)
Definition: The number of barcodes that are called as real cells in both RNA and ATAC.
Computation:
- Modality-level pre-filtering
- RNA: remove barcodes with extremely low UMI counts (GEX count).
- ATAC: remove obvious background barcodes using events in peaks, total fragments, and peak-enrichment related criteria.
- Peak-enrichment consistency filter (ATAC) For each barcode, compare fraction of fragments in peaks vs fraction of genome in peaks. If the former is lower than the latter, the barcode is considered more consistent with random background cutting and is filtered out.
- Joint cell calling (Joint logic) Perform cell calling in RNA and ATAC separately, then apply a joint rule (e.g., clustering-based separation) to distinguish cells from background.
- Multi-omics intersection Cell calling is performed for RNA and ATAC separately, and only barcodes called as “cells” in both modalities are kept as the Joint cell set. Its size is reported as Estimated number of cells.
- Modality-level pre-filtering
Interpretation:
- This metric reflects the effective number of cells available for joint multi-omics analyses, and directly impacts WNN clustering, peak–gene linkage, and regulatory inference.
- It is influenced by loaded cell number, library efficiency, cell viability, sequencing depth, and cell-calling parameters.
- Typical range: often 6,000–15,000 in common experiments.
- If much higher than expected, check:
- whether ATAC peak enrichment and TSS enrichment are low (background barcodes may be misclassified as cells);
- whether many non-cells overlap with the cell cloud in the joint scatter plot.
- If much lower than expected, cross-check:
- loading/aggregation and experimental cell counts;
- Mean raw read pairs per cell and the Estimated number of cells in RNA and ATAC individually;
- if single-modality cell counts are sufficient but Joint is much lower, it often indicates a large quality imbalance between modalities for the same barcodes (e.g., one modality failed).
GEX Median genes per cell (Joint)
Definition: The median number of detected genes per cell within the Joint cell set.
Computation:
- In the RNA expression matrix (filtered_feature_bc_matrix), keep only barcodes in the Joint cell set.
- For each cell, count genes with UMI > 0 to form a per-cell “genes detected” vector.
- Take the median of this vector as GEX Median genes per cell.
- If --include-introns is enabled, intronic reads contribute to the expression matrix, typically increasing both gene detection and total UMI counts.
Interpretation:
- Reflects transcriptomic complexity and detection sensitivity at the single-cell level.
- Depends on sample type, transcriptional activity, sequencing depth, intron-inclusion, and filtering strategy.
- For many mammalian tissue samples, a common range is ~800–2,500 under typical settings.
- When low:
- if Mean Reads per Cell (RNA) is also low, insufficient depth is a likely driver;
- if depth is adequate, consider RNA quality/degeneration, cell state (many damaged/quiescent cells), or overly strict filtering;
- if Joint cell count is low, Joint may retain only the highest-quality subset, which can inflate this median—interpret together with Joint/RNA cell numbers.
ATAC Median high-quality fragments per cell (Joint)
Definition: The median number of high-quality ATAC fragments per cell within the Joint cell set.
Computation:
- From ATAC alignment/fragments, keep read pairs that are:
- mapped to the nuclear genome (excluding mitochondria and other non-nuclear contigs);
- with mapping quality MAPQ ≥ 30;
- non-chimeric and non-duplicate. These are counted as “high-quality fragments”.
- Count high-quality fragments per Joint barcode to form a per-cell vector.
- Take the median as ATAC Median high-quality fragments per cell.
- From ATAC alignment/fragments, keep read pairs that are:
Interpretation:
- Captures the effective ATAC information content per cell, which strongly affects peak detection, motif enrichment, and peak–gene linkage stability.
- In multi-omics experiments, > 2,000 is often considered a good level.
- If low, cross-check:
- Mean raw read pairs per cell (ATAC): low depth suggests adding sequencing or rebuilding;
- Fraction of high-quality fragments in cells (ATAC): low fraction indicates fragments dominated by background/non-cell barcodes;
- Fraction of transposition events in peaks in cells (ATAC) and TSS enrichment score (ATAC): both low often indicates compromised chromatin structure or suboptimal Tn5 conditions.
Feature linkages detected / Linked genes / Linked peaks (Joint)

Definition:
- Feature linkages detected The total number of significant associations (peak–gene and/or peak–peak, depending on the workflow) identified from correlation analysis between ATAC peak accessibility and nearby gene expression in Joint cells, under a specified significance threshold (e.g., significance ≥ 5).
- Linked genes The number of genes that have at least one significant peak–gene linkage.
- Linked peaks The number of peaks that have at least one significant peak–gene linkage.
Computation:
- Start from the joint Seurat/Signac object produced by SeekArcTools, using the ATAC assay for peak accessibility and the RNA assay for expression.
- For each gene, define candidate peaks within a specified window around the TSS to create peak–gene candidate pairs.
- For each candidate pair, compute correlation across Joint cells and correct for biases (e.g., GC content, peak length, accessibility baseline) to obtain standardized statistics (e.g., Z-scores) and significance measures.
- Apply thresholds and count:
- total significant pairs = Feature linkages detected;
- unique genes covered = Linked genes;
- unique peaks covered = Linked peaks.
Interpretation:
- Together, these metrics summarize the number and coverage of regulatory “edges” supported by the joint multi-omics dataset.
- Strongly depends on:
- Joint cell count and per-cell ATAC/RNA information content;
- peak set quality and resolution;
- within-sample heterogeneity (homogeneous samples may yield fewer linkages).
- Low values do not necessarily imply poor data; interpret with:
- Estimated number of cells (Joint) and per-cell depth to assess scale limitations;
- whether peaks/gene annotations cover the biology of interest;
- whether large-scale regulatory remodeling is biologically expected.
Joint Cell Calling Visualization (Joint)
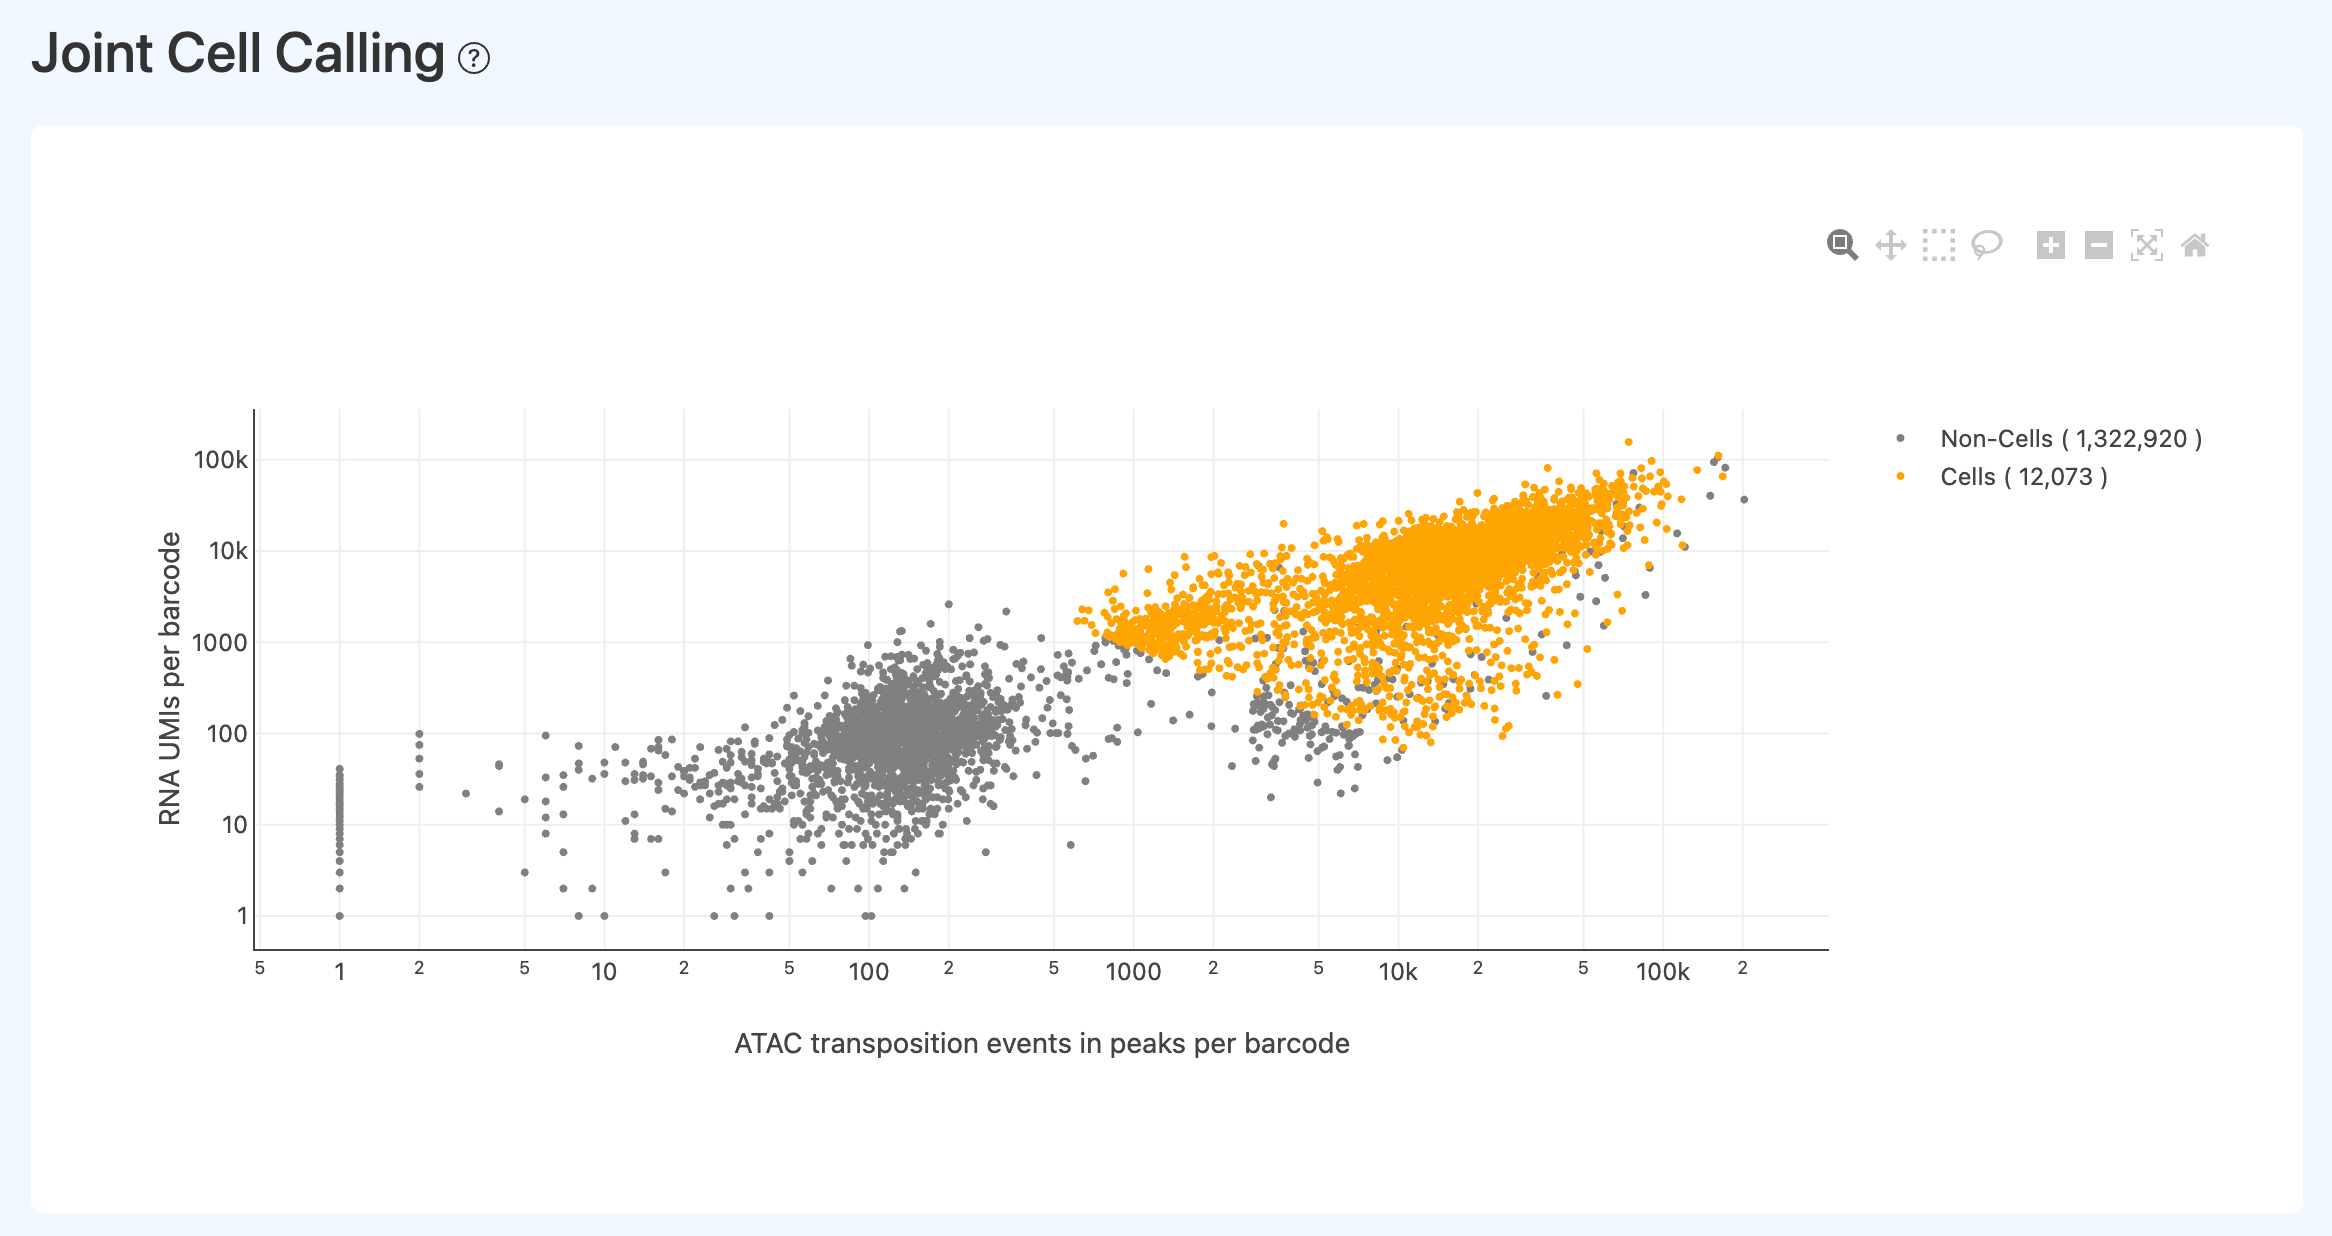
- Definition: A 2D scatter plot of all barcodes using ATAC signal (e.g., events in peaks) and RNA UMI counts as axes, colored by “cell” vs “non-cell” according to joint cell calling.
- Computation:
- For each barcode, compute:
- x-axis: ATAC events-in-peaks (or equivalent transposition event counts);
- y-axis: RNA UMI counts.
- Apply suitable transformations (e.g., log10) and sampling to improve readability.
- On retained barcodes, deduplicate/compress the log10(UMI) and log10(events in peaks) pairs and cluster them into two groups (e.g., KMeans). The cluster with higher means is treated as the “cell” cluster; the other as background.
- If --min_atac_count and --min_gex_count are provided, a hard-threshold rule is used: barcodes with UMI ≥ min_gex_count and events ≥ min_atac_count are directly called as cells.
- Color points by joint cell-calling labels and visualize the distribution of Joint cells vs background barcodes.
- For each barcode, compute:
- Interpretation:
- Used to visually assess whether the joint cell-calling boundary is reasonable:
- ideally, cells cluster in the upper-right and are well separated from background in the lower-left;
- heavy mixing of non-cells into the upper-right suggests overly permissive thresholds or weak ATAC enrichment that makes background hard to separate.
- Interpret together with ATAC Peak targeting, Fraction of high-quality fragments in cells, Fraction of transposition events in peaks in cells, and RNA Fraction Reads in Cells.
- Used to visually assess whether the joint cell-calling boundary is reasonable:
Cluster embedding (ATAC/GEX, Joint)
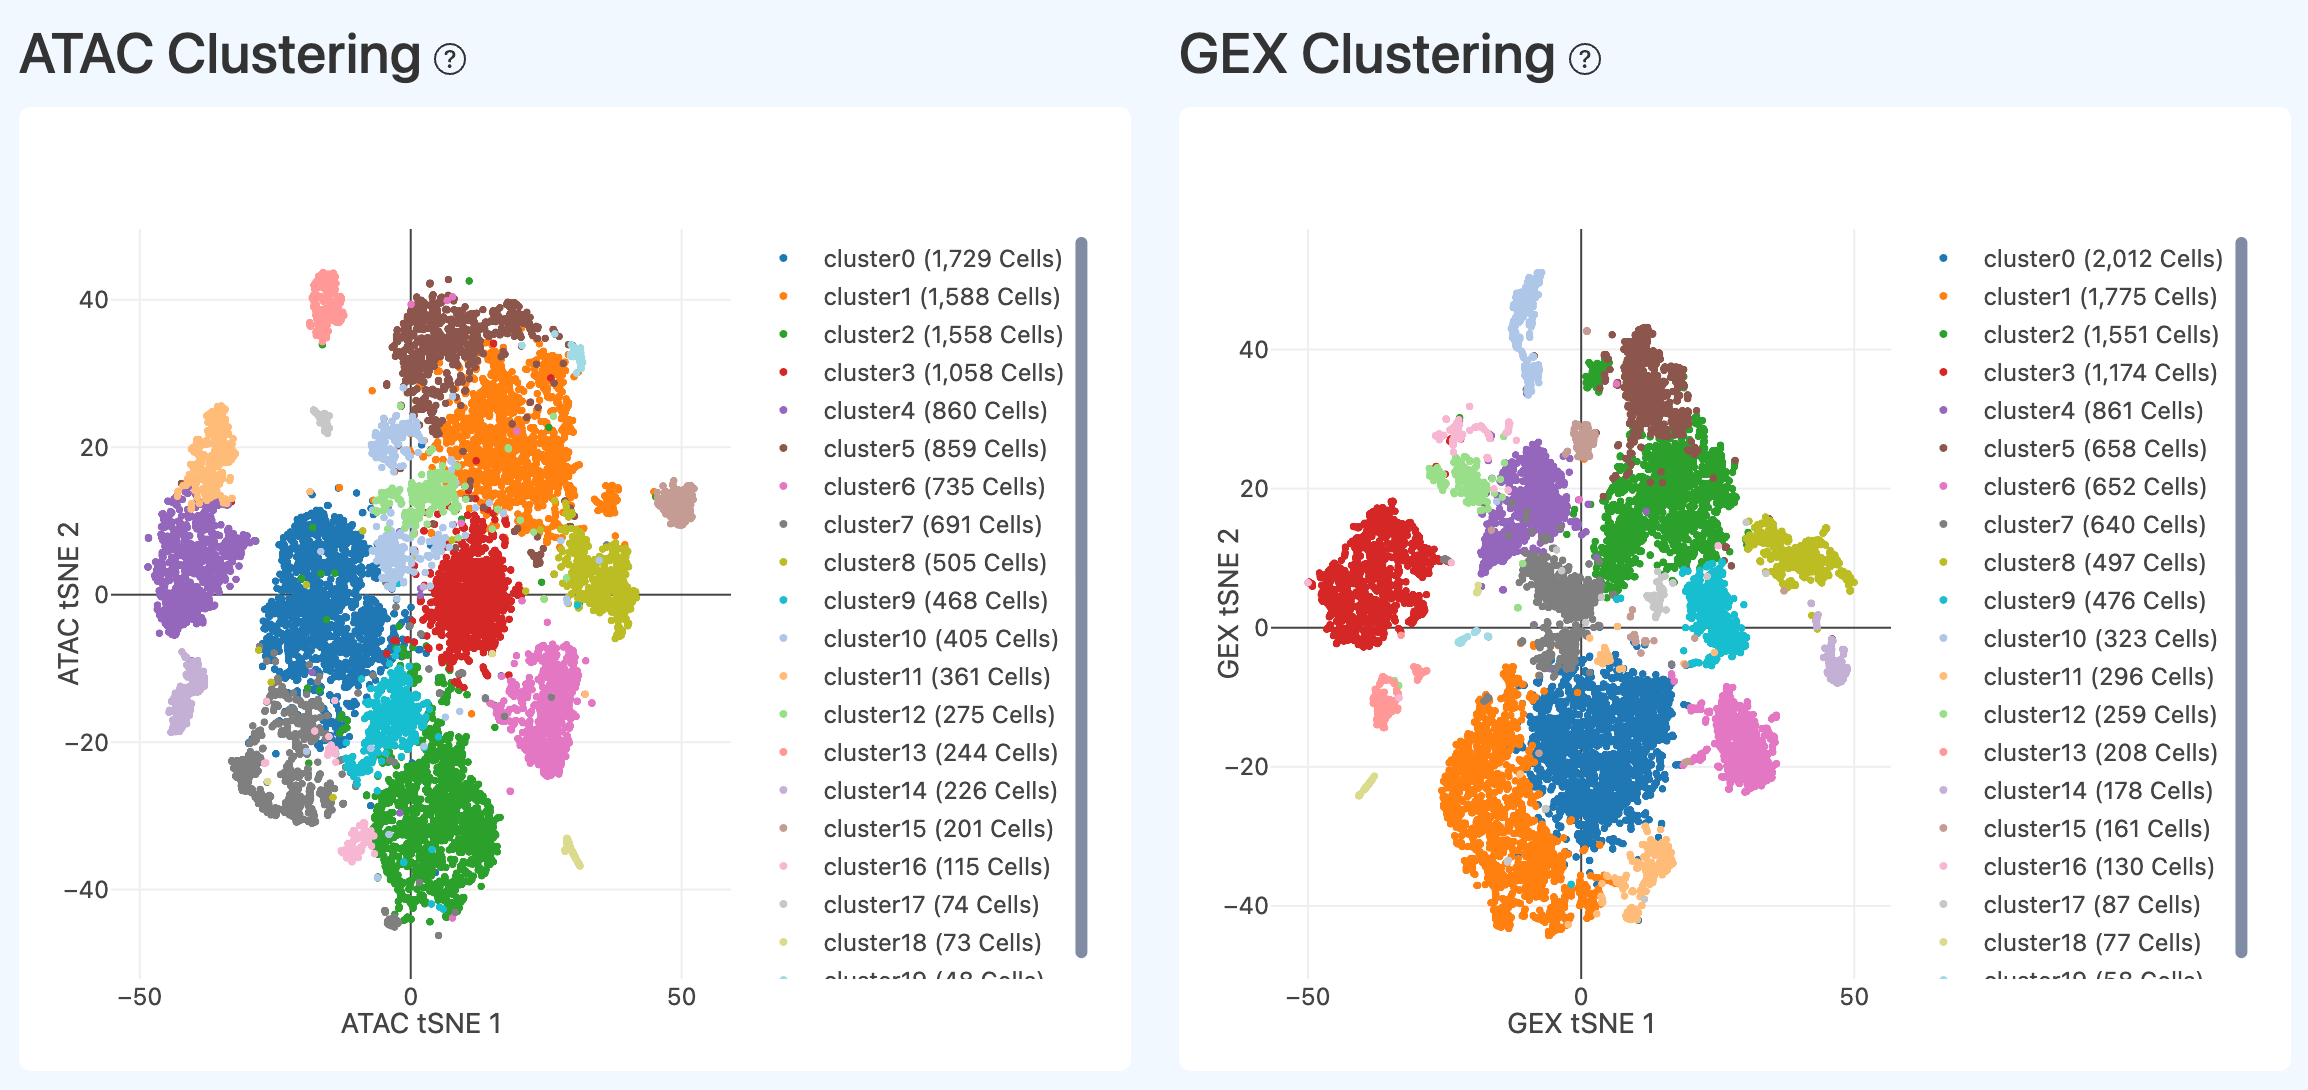
- Definition: Low-dimensional embeddings (e.g., tSNE1/2) computed on Joint cells using ATAC features and RNA (GEX) features separately, colored by cluster labels.
- Computation: Build modality-specific neighbor graphs and clusters on the Joint cell set, then plot embeddings colored by clusters.
- Interpretation: Under normal conditions, clusters are compact and well separated in the embedding. If separation is weak, it may indicate low biological heterogeneity or potential technical issues; however, homogeneous samples (e.g., cultured cell lines or purified single cell types) can also naturally show limited separation.
Depth distribution on embeddings (ATAC/GEX, Joint)
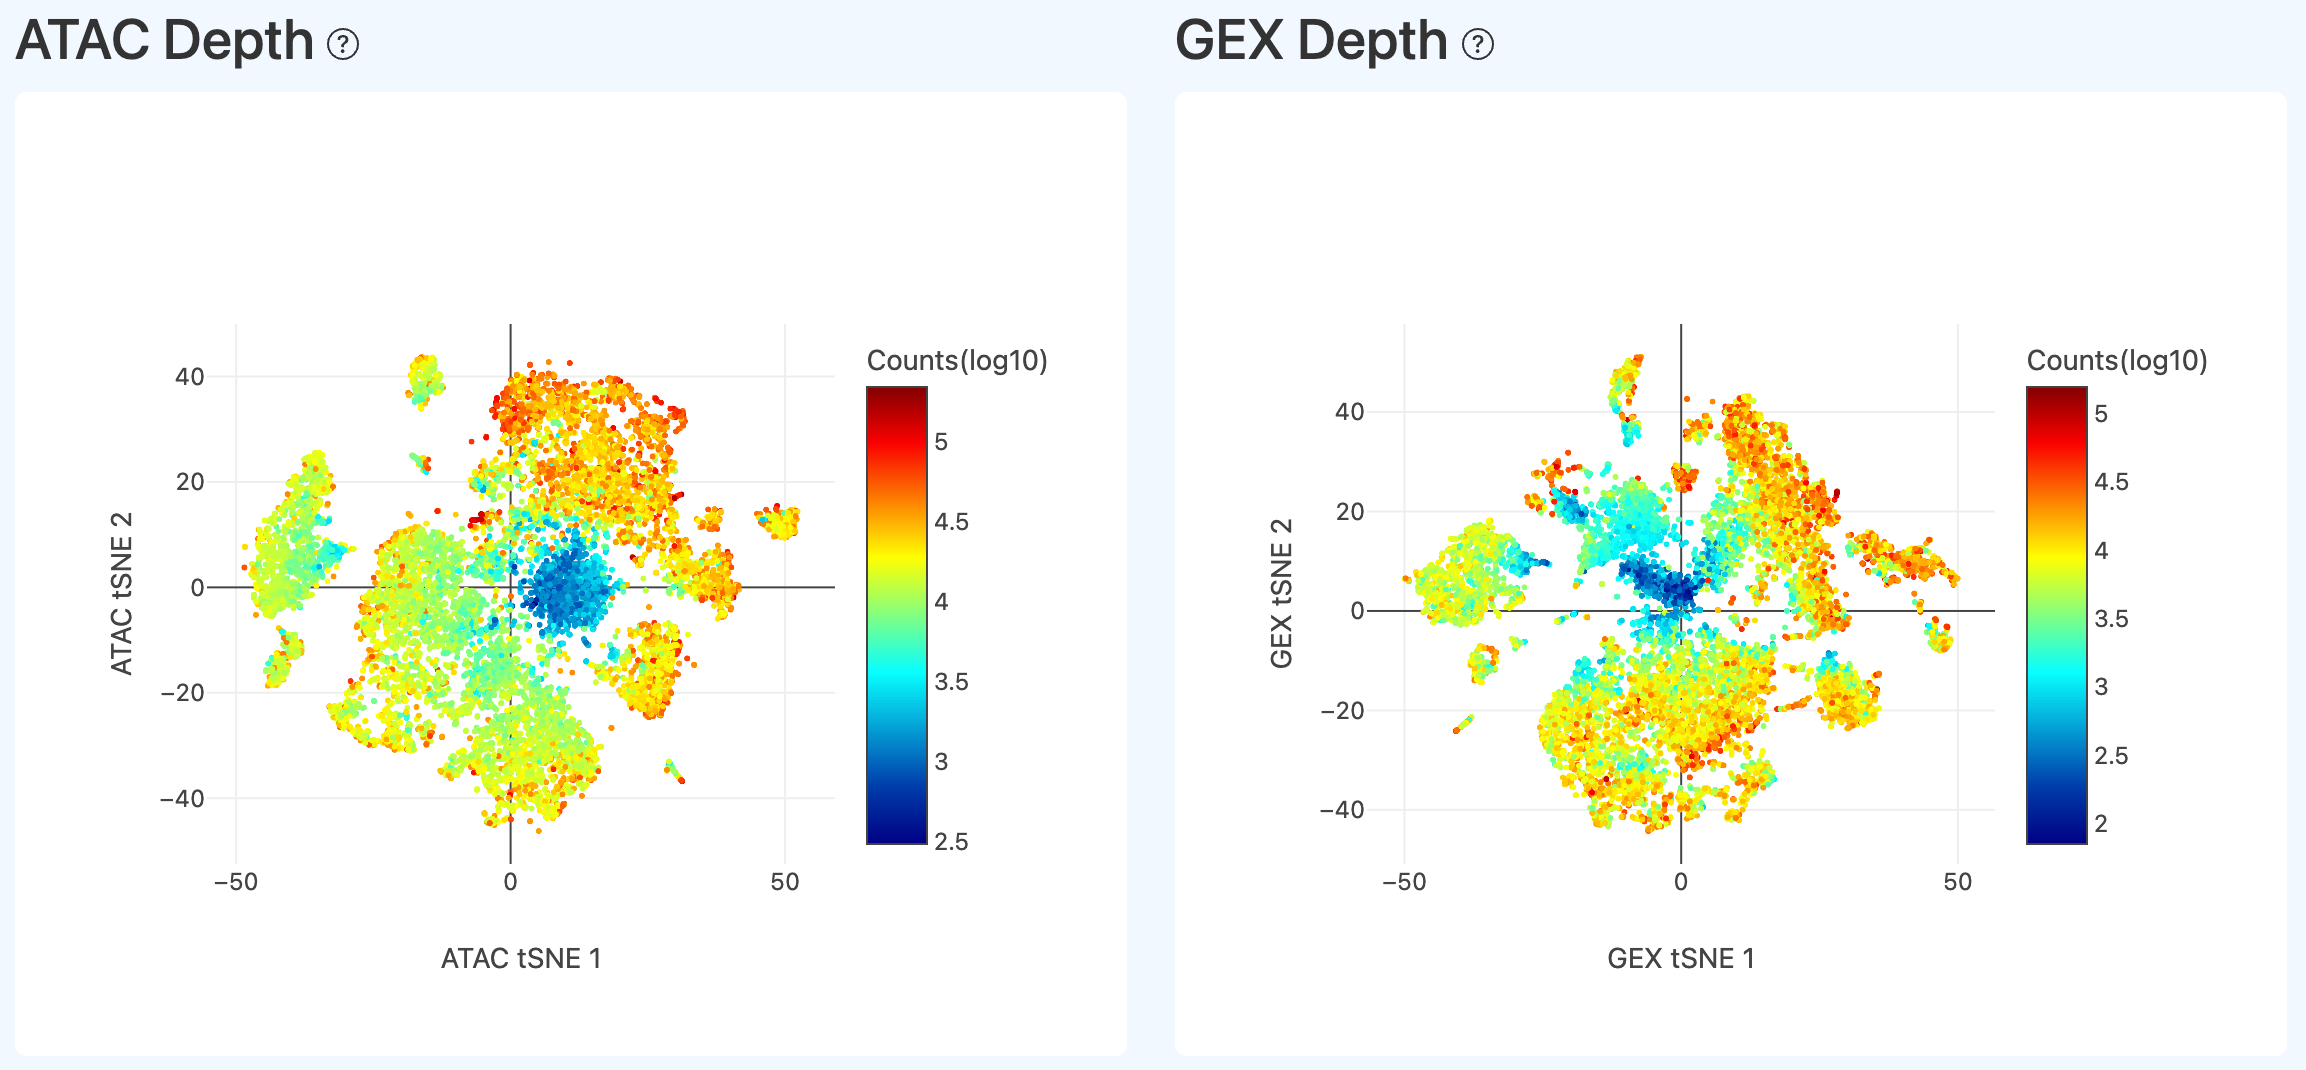
- Definition: Depth overlays on the ATAC and GEX embeddings: RNA shows per-cell UMI count distribution; ATAC shows per-cell transposition event (events) distribution.
- Computation: On the Joint cell set, compute ATAC depth (events per cell) and RNA depth (UMI per cell), apply log transformation, and color the corresponding embeddings by depth.
- Interpretation: Typically, depth distribution is relatively even. If a large region shows low UMI counts or low events, it may indicate that many low-quality/non-cell barcodes were called as cells; confirm using additional QC metrics.
RNA Metrics
This section reports sequencing quality, mapping performance, and key quantitative metrics for the single-cell RNA library, helping evaluate RNA data quality and its suitability for downstream analyses.
Sequencing (RNA)
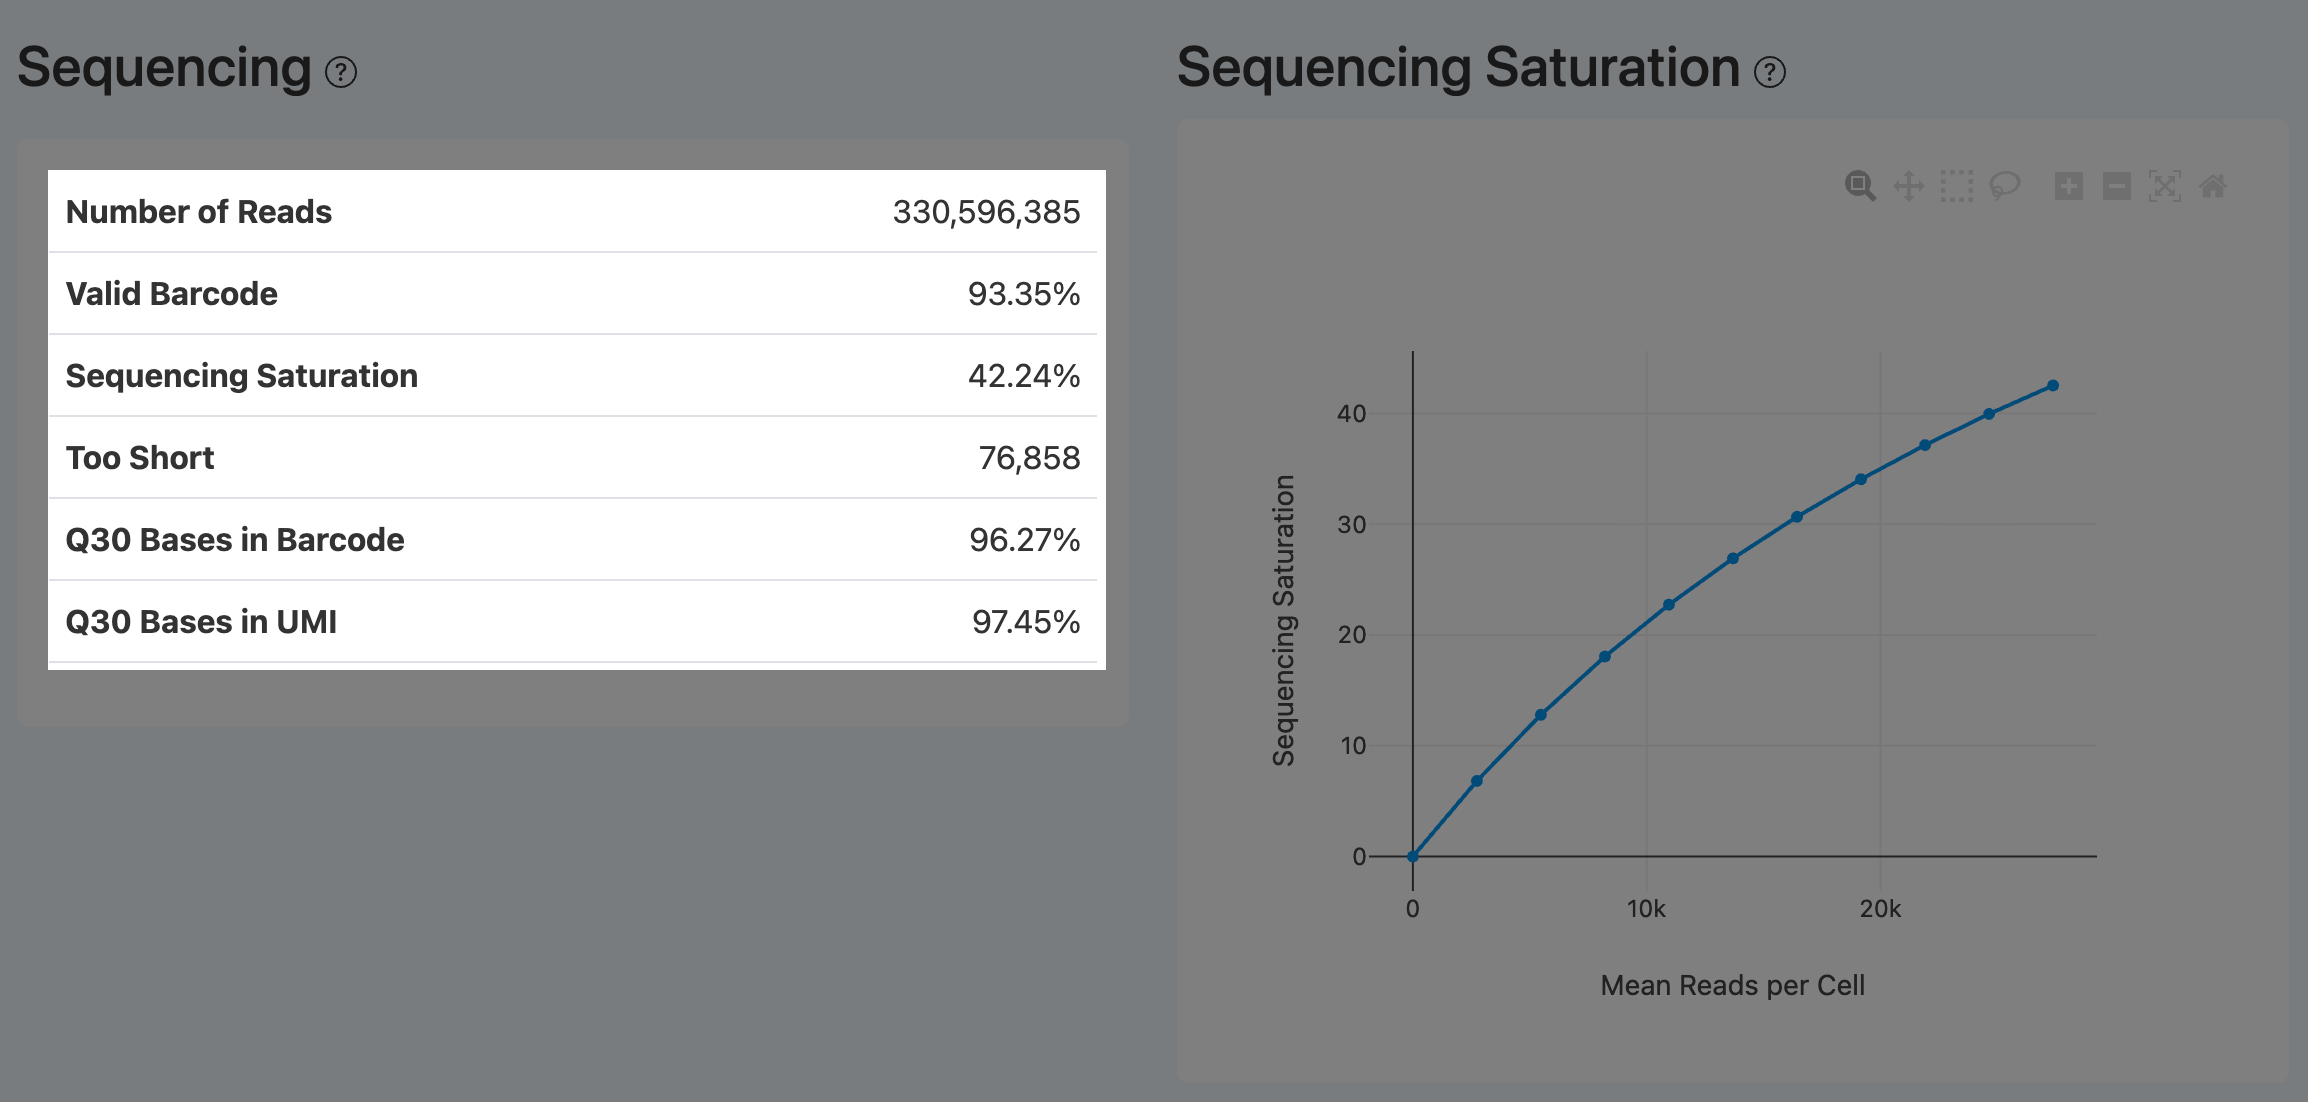
Number of Reads (RNA Sequencing)
Definition: Total number of RNA read pairs retained after preprocessing QC (e.g., adapter trimming, quality/length filtering).
Computation: Count all read pairs that pass preprocessing filters after adapter removal, quality trimming, and length filtering.
Interpretation:
- Reflects the effective sequencing data volume available for downstream analysis.
- Should be interpreted together with valid barcode fraction, reads-in-cells fraction, and sequencing saturation, rather than using sequencing volume alone.
Valid Barcode (RNA Sequencing)
- Definition: Fraction of RNA read pairs whose barcode sequences can be corrected (if applicable) and successfully matched to the whitelist.
- Computation:
- Parse barcode sequences from reads.
- Apply barcode correction rules (e.g., allow 1 mismatch; optionally discard reads that can be corrected to multiple whitelist barcodes).
- Count read pairs matched to the whitelist and divide by Number of Reads.
- Interpretation:
- Reflects barcode synthesis quality, sequencing accuracy, and whitelist compatibility. Recommended Valid Barcode ≥ 75%.
- If low, examine Barcode Q30 and reads-in-cells fraction to distinguish sequencing quality issues from library structure/whitelist mismatches.
Sequencing Saturation (RNA)
- Definition: Degree of molecular re-sequencing (duplication) at the current sequencing depth.
- Computation: Sequencing Saturation = 1 − (number of unique UMIs / number of reads used for UMI counting).
- Interpretation:
- Quantifies the relationship between sequencing depth and library complexity.
- Low saturation suggests many molecules remain unsampled; very high saturation suggests additional reads are mostly duplicates with limited information gain.
- Interpret together with trends in Median Genes per Cell (RNA Cells) and Median UMI Counts per Cell (RNA Cells) to decide whether further sequencing is beneficial.
Too Short (RNA)
- Definition: Fraction of reads discarded after adapter removal because read length is below the minimum retention threshold.
- Computation: After adapter trimming, count reads filtered as too short and divide by Number of Reads.
- Interpretation:
- Reflects insert size distribution and library integrity.
- High values often indicate substantial adapter contamination, short inserts, or degradation during library construction, reducing mappable reads and impacting quantification.
Q30 Bases in Barcode (RNA)
- Definition: Fraction of bases in the barcode read with Phred quality ≥ Q30.
- Computation: Count barcode bases with Phred ≥ 30 divided by total barcode bases.
- Interpretation:
- Reflects barcode read quality. Recommended Q30 Bases in Barcode ≥ 80%.
- Low barcode Q30 can reduce barcode matching accuracy and decrease the number of detected cells.
Q30 Bases in UMI (RNA)
- Definition: Fraction of bases in the UMI read with Phred quality ≥ Q30.
- Computation: Count UMI bases with Phred ≥ 30 divided by total UMI bases.
- Interpretation:
- Reflects UMI read quality. Recommended Q30 Bases in UMI ≥ 80%.
- Higher UMI Q30 improves deduplication accuracy and increases reliability of transcript quantification.
Mapping (RNA)

Reads Mapped to Genome (RNA Mapping)
- Definition: Fraction of RNA reads that successfully map to the reference genome among reads entering alignment.
- Computation: After barcode identification and too-short filtering, divide the number of mapped reads (unique + multi-mapped) by the total aligned reads.
- Interpretation:
- Reflects compatibility between reads and the reference and overall library specificity.
- Low mapping can be caused by contamination, high low-complexity content, or reference version mismatch; interpret with confident unique mapping and exonic/intronic/intergenic distributions.
Reads Mapped Confidently to Genome (RNA Mapping)
- Definition: Fraction of reads that uniquely map to a single genomic locus with high confidence.
- Computation: Count reads meeting mapping quality thresholds with a single best alignment, divided by total aligned reads.
- Interpretation:
- Reflects the fraction of reads suitable for robust expression quantification.
- A large gap between overall mapping and confident mapping often indicates repeats/complex regions or insufficient sequencing quality; interpret with exon/intron/intergenic distributions.
Reads Mapped to Exonic Regions (RNA)
- Definition: Fraction of mapped RNA reads that fall into annotated exonic regions.
- Computation: Exonic mapped reads divided by total mapped reads.
- Interpretation: Higher exonic fraction suggests enrichment for mature mRNA and benefits expression quantification.
Reads Mapped to Intronic Regions (RNA)
- Definition: Fraction of mapped RNA reads that fall into annotated intronic regions.
- Computation: Intronic mapped reads divided by total mapped reads.
- Interpretation: Reflects the contribution from unspliced/nuclear RNA; interpret jointly with exonic fraction and sample/library type.
Reads Mapped to Intergenic Regions (RNA)
- Definition: Fraction of mapped RNA reads that fall into annotated intergenic regions.
- Computation: Intergenic mapped reads divided by total mapped reads.
- Interpretation: Elevated values can reflect incomplete annotation, reference mismatch, non-coding transcription, or non-specific alignments; interpret with overall mapping and exon/intron balance.
Cells (RNA)
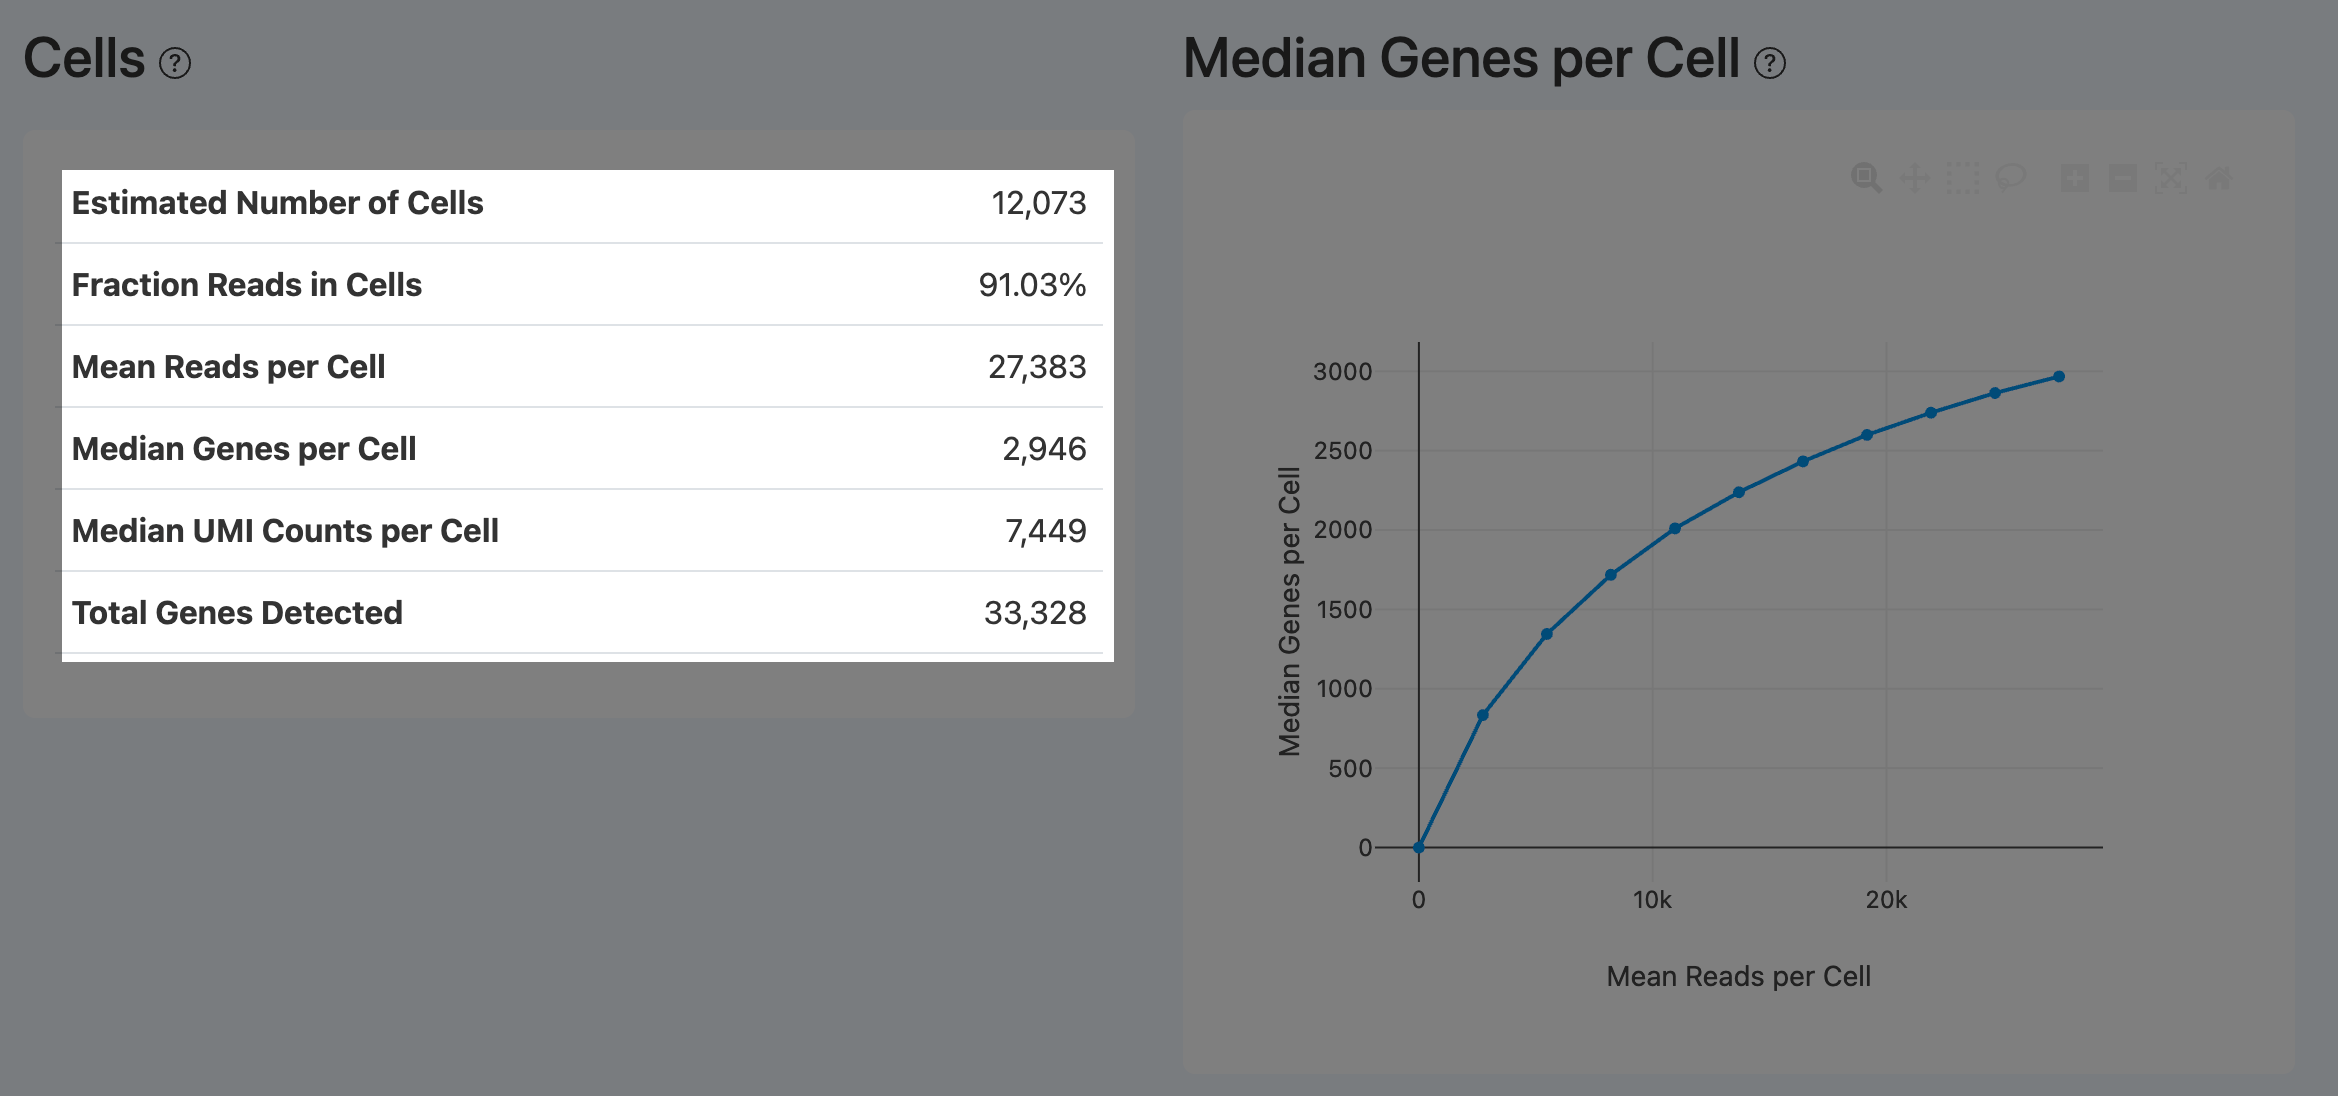
Estimated Number of Cells (RNA Cells)
- Definition: Number of barcodes called as real cells in the RNA modality.
- Computation: Use RNA UMI-based signals to filter and separate cells from background (via clustering or thresholds), then count barcodes in the RNA cell set.
- Interpretation: This value is consistent with Estimated number of cells in the Joint section.
Fraction Reads in Cells (RNA Cells)
- Definition: Fraction of genome-mapped RNA reads that originate from barcodes called as cells.
- Computation: Reads assigned to cell barcodes divided by all genome-mapped reads.
- Interpretation:
- Measures the fraction of signal attributable to real cells and is important for assessing ambient RNA/empty droplets/lysis effects.
- Low values suggest substantial background contribution; review sample preparation and loading concentration.
Mean Reads per Cell (RNA)
- Definition: Average number of sequencing reads assigned per cell barcode.
- Computation: Total reads assigned to cell barcodes divided by the number of called cells.
- Interpretation:
- Captures per-cell sequencing depth allocation.
- Higher depth can stabilize quantification, but should be interpreted with saturation and library complexity.
Median Genes per Cell (RNA)
- Definition: Median number of detected genes per cell among RNA-called cells.
- Computation: For each cell, count genes with at least one UMI, then take the median.
- Interpretation:
- Reflects RNA detection sensitivity and complexity.
- Higher values often indicate better library quality and/or higher sequencing depth.
Median UMI Counts per Cell (RNA)
- Definition: Median number of unique UMIs per cell among RNA-called cells.
- Computation: Count unique UMIs per cell (deduplicated), then take the median.
- Interpretation: Represents typical transcript molecule capture level; interpret with depth and complexity.
Total Genes Detected (RNA)
- Definition: Total number of distinct genes detected across all called RNA cells.
- Computation: Aggregate genes with non-zero UMI counts across all called cells after UMI deduplication and count distinct genes.
- Interpretation: Reflects overall gene coverage, and depends on cell number, depth, and sample type.
Sequencing Depth and Saturation Analysis (RNA)
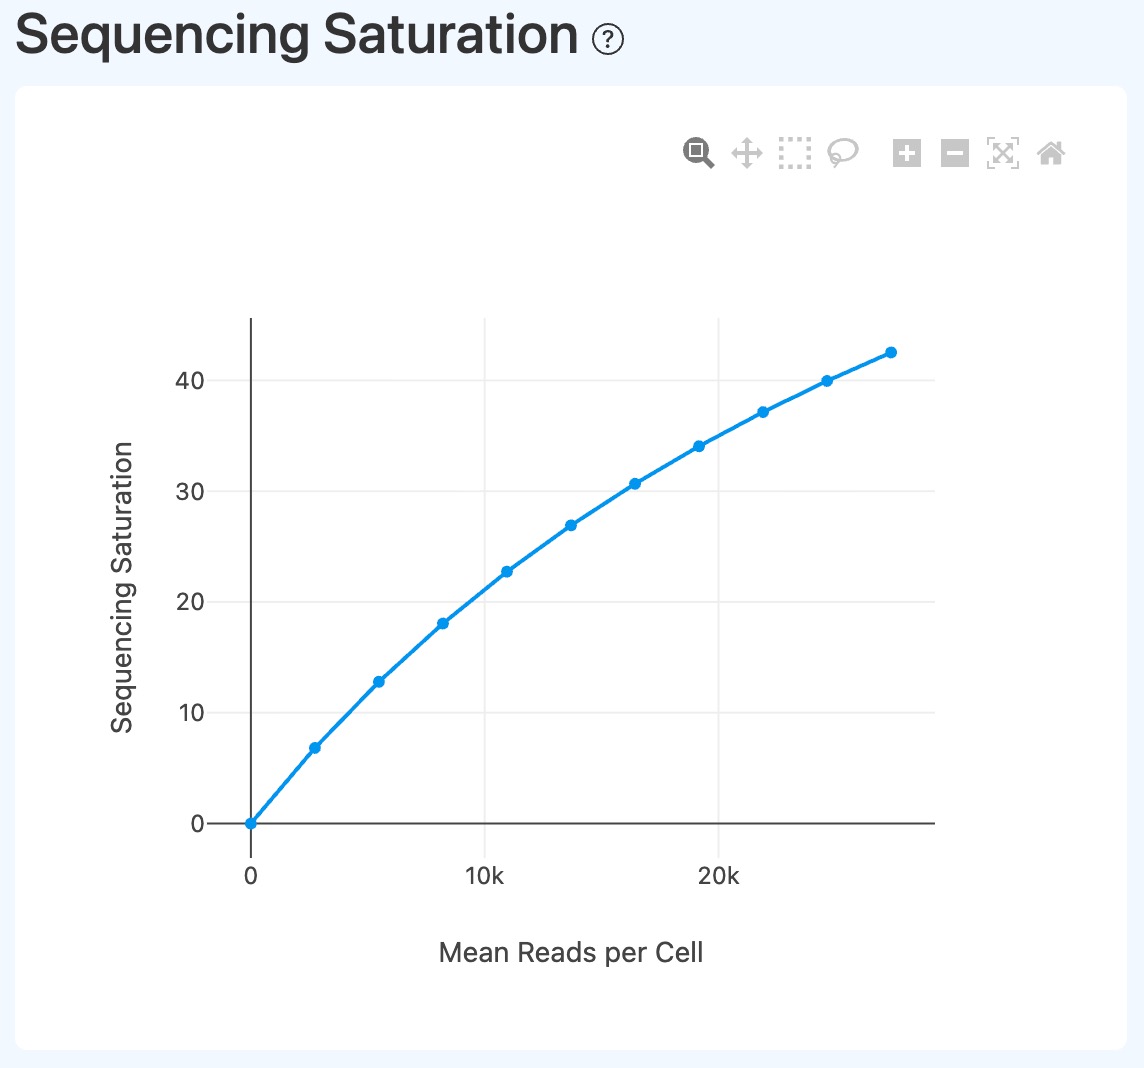
Sequencing Saturation (RNA downsampling)
- Definition: Downsampling-based curve showing how sequencing saturation changes with sequencing depth (x-axis represents downsampled information level; y-axis is saturation).
- Interpretation:
- Used to assess the depth–complexity relationship.
- Saturation typically increases with depth; a plateau indicates diminishing returns from additional sequencing.
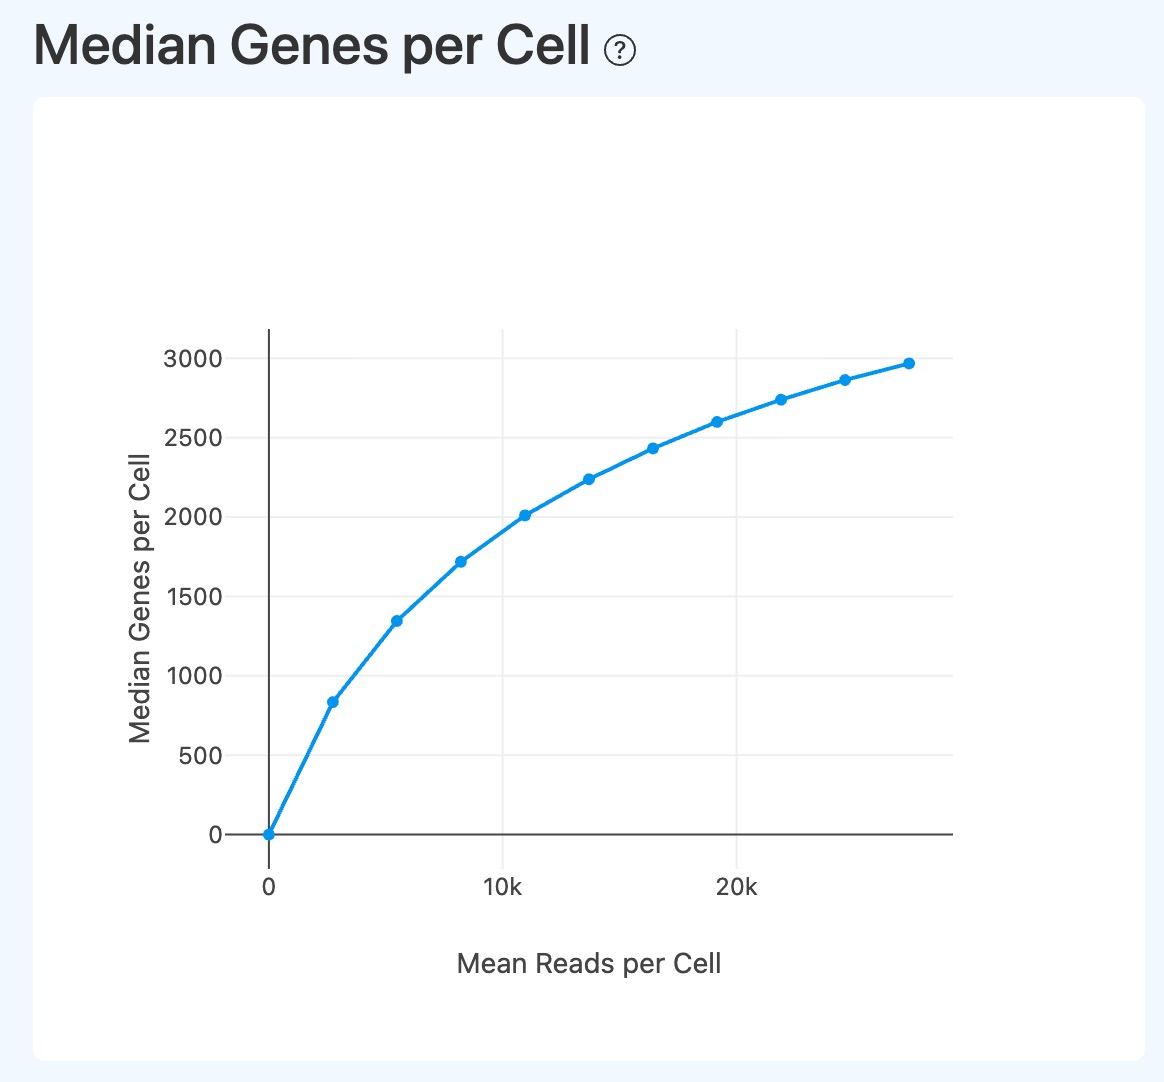
Median Genes per Cell (RNA downsampling)
- Definition: Downsampling-based curve showing how median genes per cell changes with mean reads per cell.
- Interpretation:
- Used to evaluate saturation of gene detection with increasing per-cell depth.
- A plateau indicates limited additional gene discovery from deeper sequencing.
ATAC Metrics
The ATAC section evaluates sequencing quality, mapping quality, usable fragment information, peak/TSS signal structure, and cell-calling/peak-targeting efficiency—core indicators for whether chromatin accessibility signals are reliable.
Sequencing (ATAC)
Sequenced read pairs (ATAC)
- Definition: Total number of ATAC read pairs retained after preprocessing QC (e.g., fastp), for barcode parsing and alignment.
- Computation: After adapter/constant-sequence processing and length/quality filtering, count read pairs that remain properly paired.
- Interpretation: Represents the total usable ATAC reads; interpret together with Valid barcodes and Percent duplicates.
Valid barcodes (ATAC)
- Definition: Fraction of ATAC read pairs whose barcode sequences can be corrected (if applicable) and successfully matched to the whitelist.
- Computation:
- Parse barcode sequences from reads.
- Apply correction rules (e.g., allow 1 mismatch; optionally discard ambiguously correctable reads).
- Count read pairs matched to the whitelist and divide by the effective read-pair total.
- Interpretation:
- Reflects barcode synthesis quality, sequencing accuracy, and whitelist compatibility. Recommended Valid barcodes ≥ 75%.
- If low, examine Barcode Q30 and reads-in-cells fraction to distinguish sequencing issues from whitelist/library-structure issues.
Too Short (ATAC)
- Definition: Fraction of reads discarded after adapter removal because read length is below the minimum retention threshold.
- Computation: After trimming, count reads filtered as too short and divide by the total effective read count (library-specific definition).
- Interpretation:
- Reflects insert size distribution and library integrity for the ATAC library.
- High values often indicate adapter contamination, short inserts, or degradation, potentially reducing mapping efficiency and destabilizing peak-related metrics.
Q30 bases in barcode (ATAC)
- Definition: Fraction of bases in the barcode read with Phred quality ≥ Q30.
- Computation: Count barcode bases with Phred ≥ 30 divided by total barcode bases.
- Interpretation:
- Reflects barcode read quality. Recommended Q30 Bases in Barcode ≥ 80%.
- Low values can reduce barcode matching accuracy.
Q30 bases in read 1 (ATAC)
- Definition: Fraction of bases in Read 1 with Phred quality ≥ Q30.
- Computation: Count Read 1 bases with Phred ≥ 30 divided by total Read 1 bases.
- Interpretation:
- Reflects Read 1 quality. Since Read 1 contains a fixed linker ME sequence, it may slightly reduce the overall sequencing quality.Recommended Q30 bases in read 1 ≥ 50%.
- Low Q30 may increase Unmapped read pairs and destabilize downstream peak-related metrics.
Q30 bases in read 2 (ATAC)
- Definition: Fraction of bases in Read 2 with Phred quality ≥ Q30.
- Computation: Count Read 2 bases with Phred ≥ 30 divided by total Read 2 bases.
- Interpretation:
- Reflects Read 2 quality. Recommended Q30 bases in read 2 ≥ 80%.
- Low Q30 may increase Unmapped read pairs and destabilize downstream peak-related metrics.
Percent duplicates (ATAC)
- Definition: Fraction of high-quality read pairs identified as PCR duplicates, used to assess saturation and library complexity.
- Computation: After defining high-quality read pairs (valid barcode, nuclear mapping, MAPQ ≥ 30, non-chimeric, etc.), count read pairs with identical fragment endpoints as duplicates. Percent duplicates = duplicates / high-quality read pairs.
- Interpretation:
- Higher duplication indicates more re-sequencing of existing molecules and fewer new unique fragments gained by deeper sequencing.
- Joint interpretation: first examine the Median Unique Fragments per Cell downsampling curve; if it plateaus and duplicates are high, the library is saturated. Then evaluate Median high-quality fragments per cell, Fraction of transposition events in peaks in cells, and TSS enrichment score. High duplicates with good core metrics often reflects sufficient depth; high duplicates with poor core metrics suggests low-complexity libraries and ineffective depth accumulation.
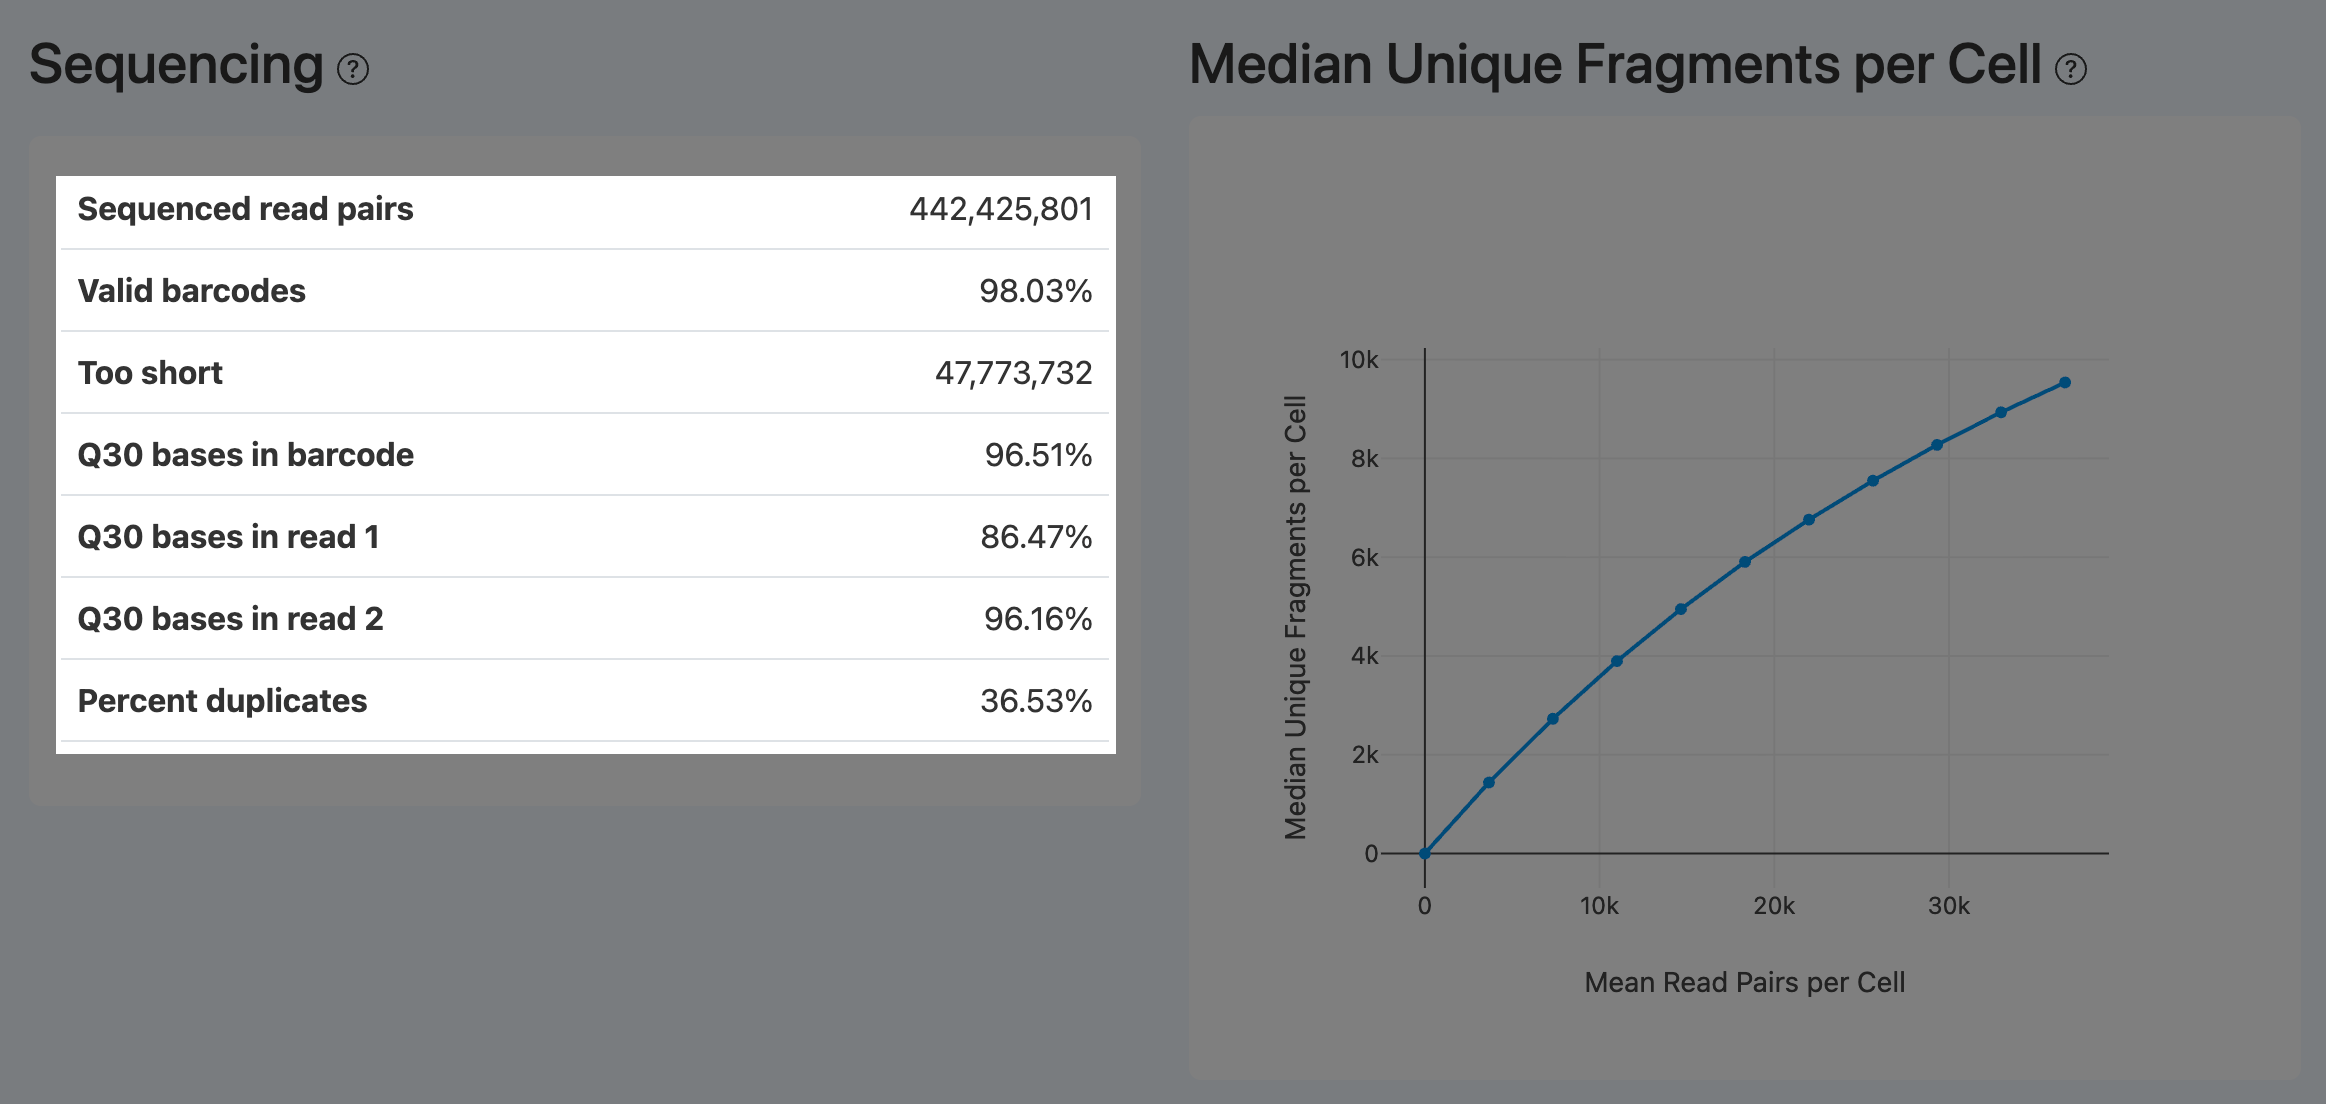
Median Unique Fragments per Cell (ATAC)
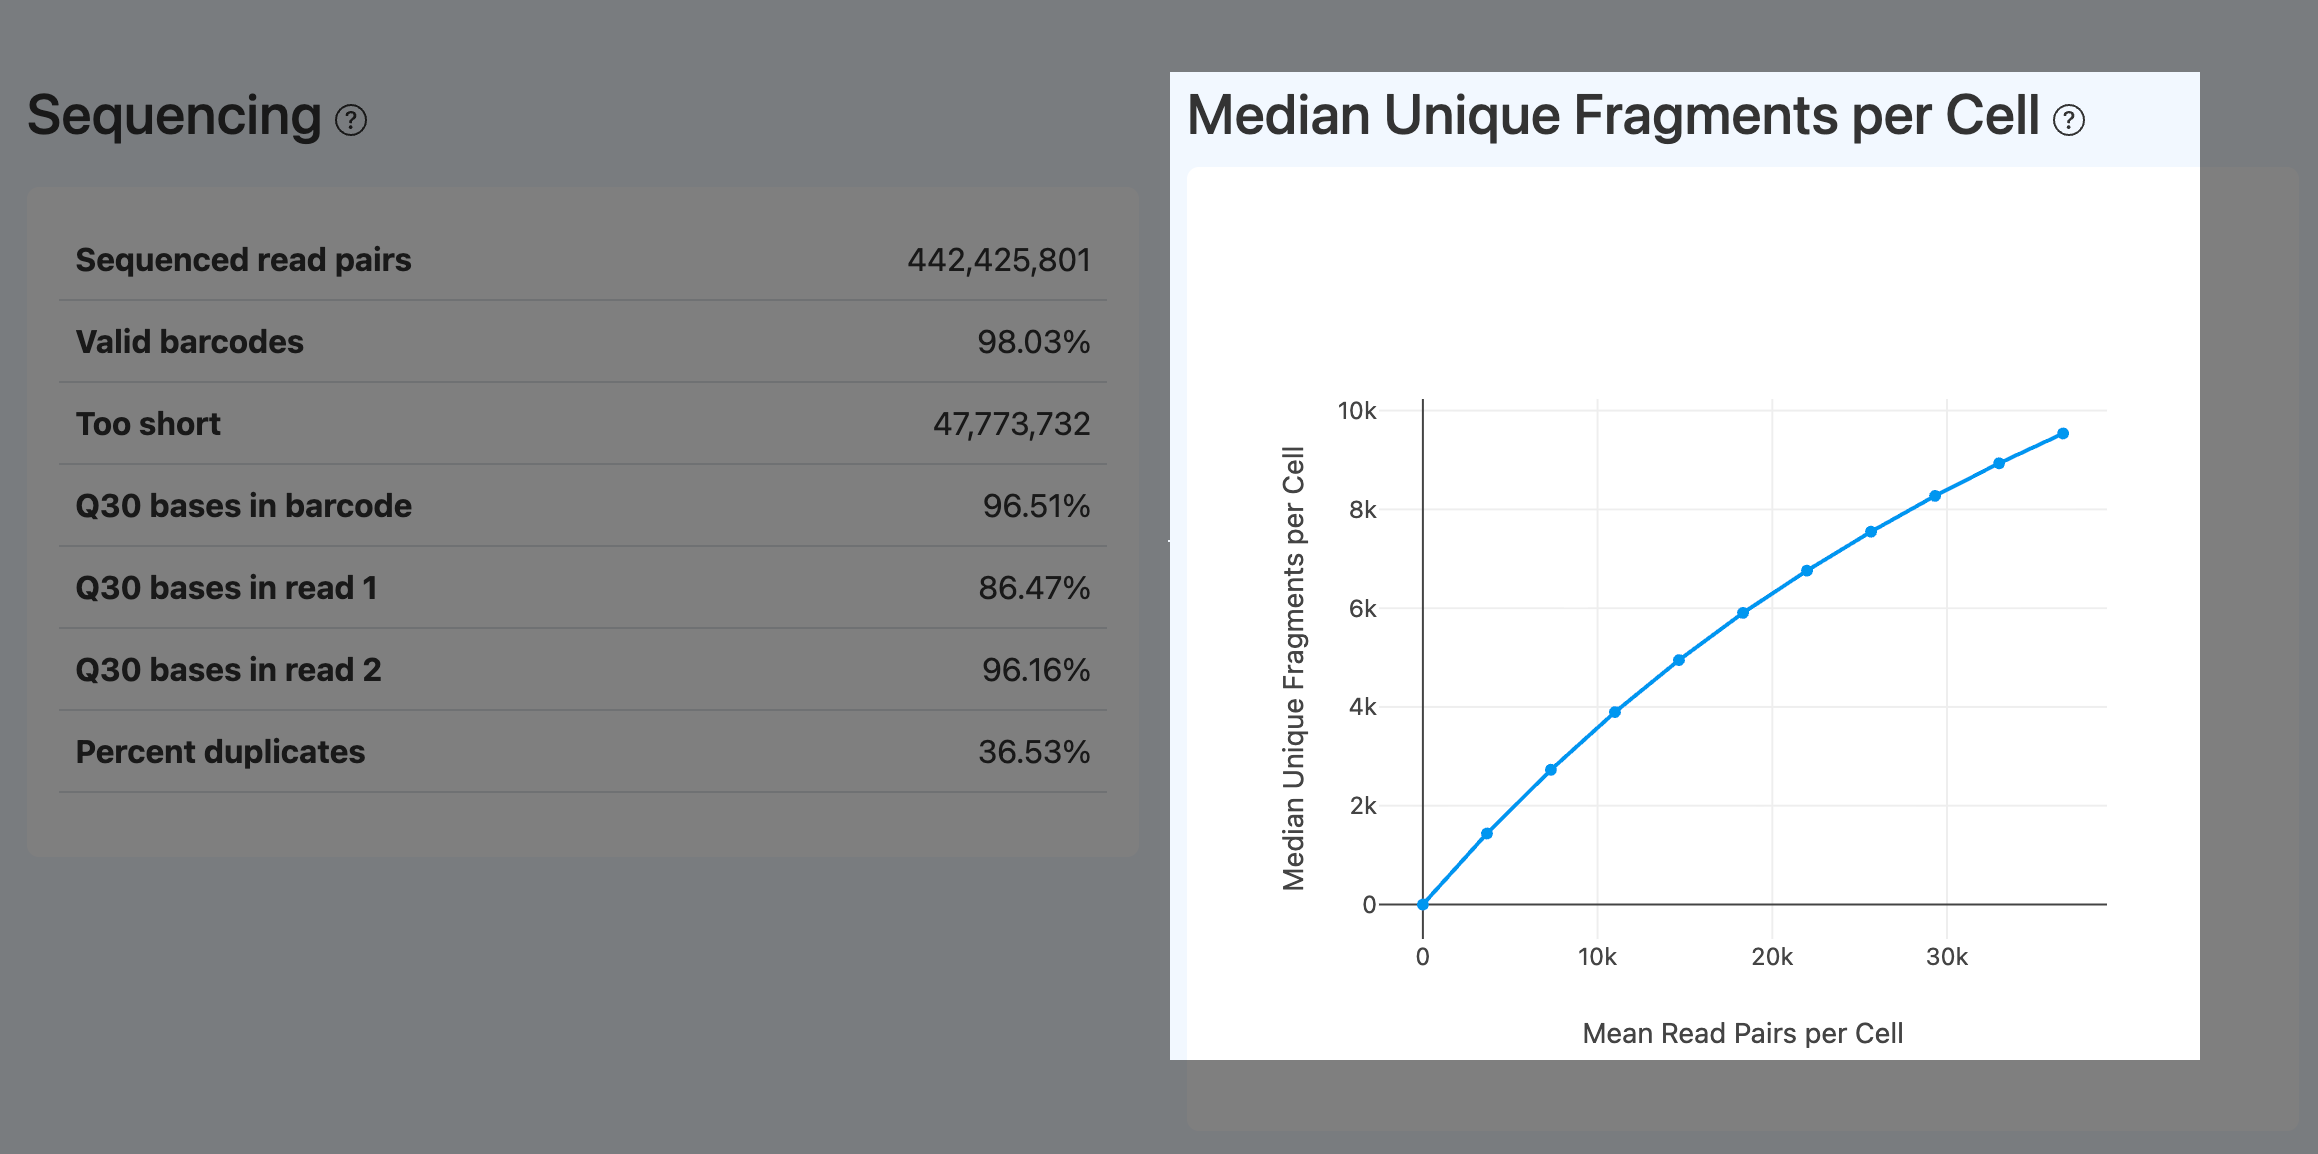
- Definition: Downsampling curve of the median number of unique fragments per cell, used to assess marginal gain from deeper sequencing.
- Computation: Downsample read pairs to multiple depths; at each depth, compute deduplicated fragments (often under high-quality filters), derive per-cell fragment counts, take the median, and plot the curve.
- Interpretation:
- Near-plateau indicates saturation; additional sequencing mostly adds duplicates.
- Still increasing suggests more unique fragments can be gained, provided quality metrics such as Confidently mapped read pairs, TSS enrichment score, and Fraction of transposition events in peaks in cells are acceptable.
Cells and Peaks (ATAC)
Mean raw read pairs per cell (ATAC)
- Definition: Average number of raw read pairs per cell barcode among ATAC-called cells.
- Computation: Total read pairs assigned to ATAC-called cell barcodes divided by the number of ATAC-called cells.
- Interpretation:
- Measures per-cell depth allocation. Recommended not less than 25,000.
- If too low, fragment counts and peak detection power can drop substantially.
Fraction of high-quality fragments in cells (ATAC)
- Definition: Among all high-quality fragments, the fraction that comes from barcodes called as ATAC cells.
- Computation:
- Define high-quality fragments (nuclear, MAPQ ≥ 30, non-chimeric, non-duplicate).
- Count high-quality fragments in called cells and divide by total high-quality fragments: Fraction = HQ_in_cells / HQ_total.
- Interpretation:
- Measures whether usable ATAC fragments predominantly originate from called cells. Recommended > 30%, and not less than 15%; values > 30% are generally considered reasonable.
- Higher values indicate lower background from empty droplets/free DNA and more robust cell calling.
Fraction of transposition events in peaks in cells (ATAC Cells)
- Definition: Fraction of transposition events (or fragments) within called cells that fall into called peak intervals.
- Computation:
- Overlap deduplicated fragments with peak intervals to label peak-overlapping fragments.
- Count total events/fragments in called cells and the subset overlapping peaks.
- Compute peak-overlapping events / total events.
- Interpretation:
- Directly reflects enrichment of transposition events in functional open chromatin. Recommended > 20%, and not less than 10%; values > 20% are generally considered reasonable.
- Common heuristic: ≥ 25%. If < 10%, it often indicates major issues (high dead-cell fraction causing random cutting, suboptimal Tn5, inappropriate peak calling, or insufficient depth).
Median high-quality fragments per cell (ATAC)
- Definition: Median number of high-quality fragments per cell among ATAC-called cells.
- Computation: Same definition as the Joint metric; count high-quality fragments per cell and take the median.
- Interpretation:
- A core ATAC per-cell information metric.
- If it cannot reach expected levels despite sufficient cell count, investigate depth, peak enrichment, and TSS enrichment jointly.
Median High-Quality Fragments Overlapping Peaks per Cell (ATAC)
- Definition: Median number of peak-overlapping high-quality fragments per cell among ATAC-called cells.
- Computation: Within called cells, count high-quality fragments that overlap peaks per cell and take the median.
- Interpretation: Integrates both “usable fragments” and “peak overlap effectiveness”.
- Low can result from low high-quality fragments, poor/too-few peaks, or high background random cutting.
- Joint interpretation with Median High-Quality Fragments per Cell, Fraction of transposition events in peaks in cells, and Peak targeting plot is recommended.
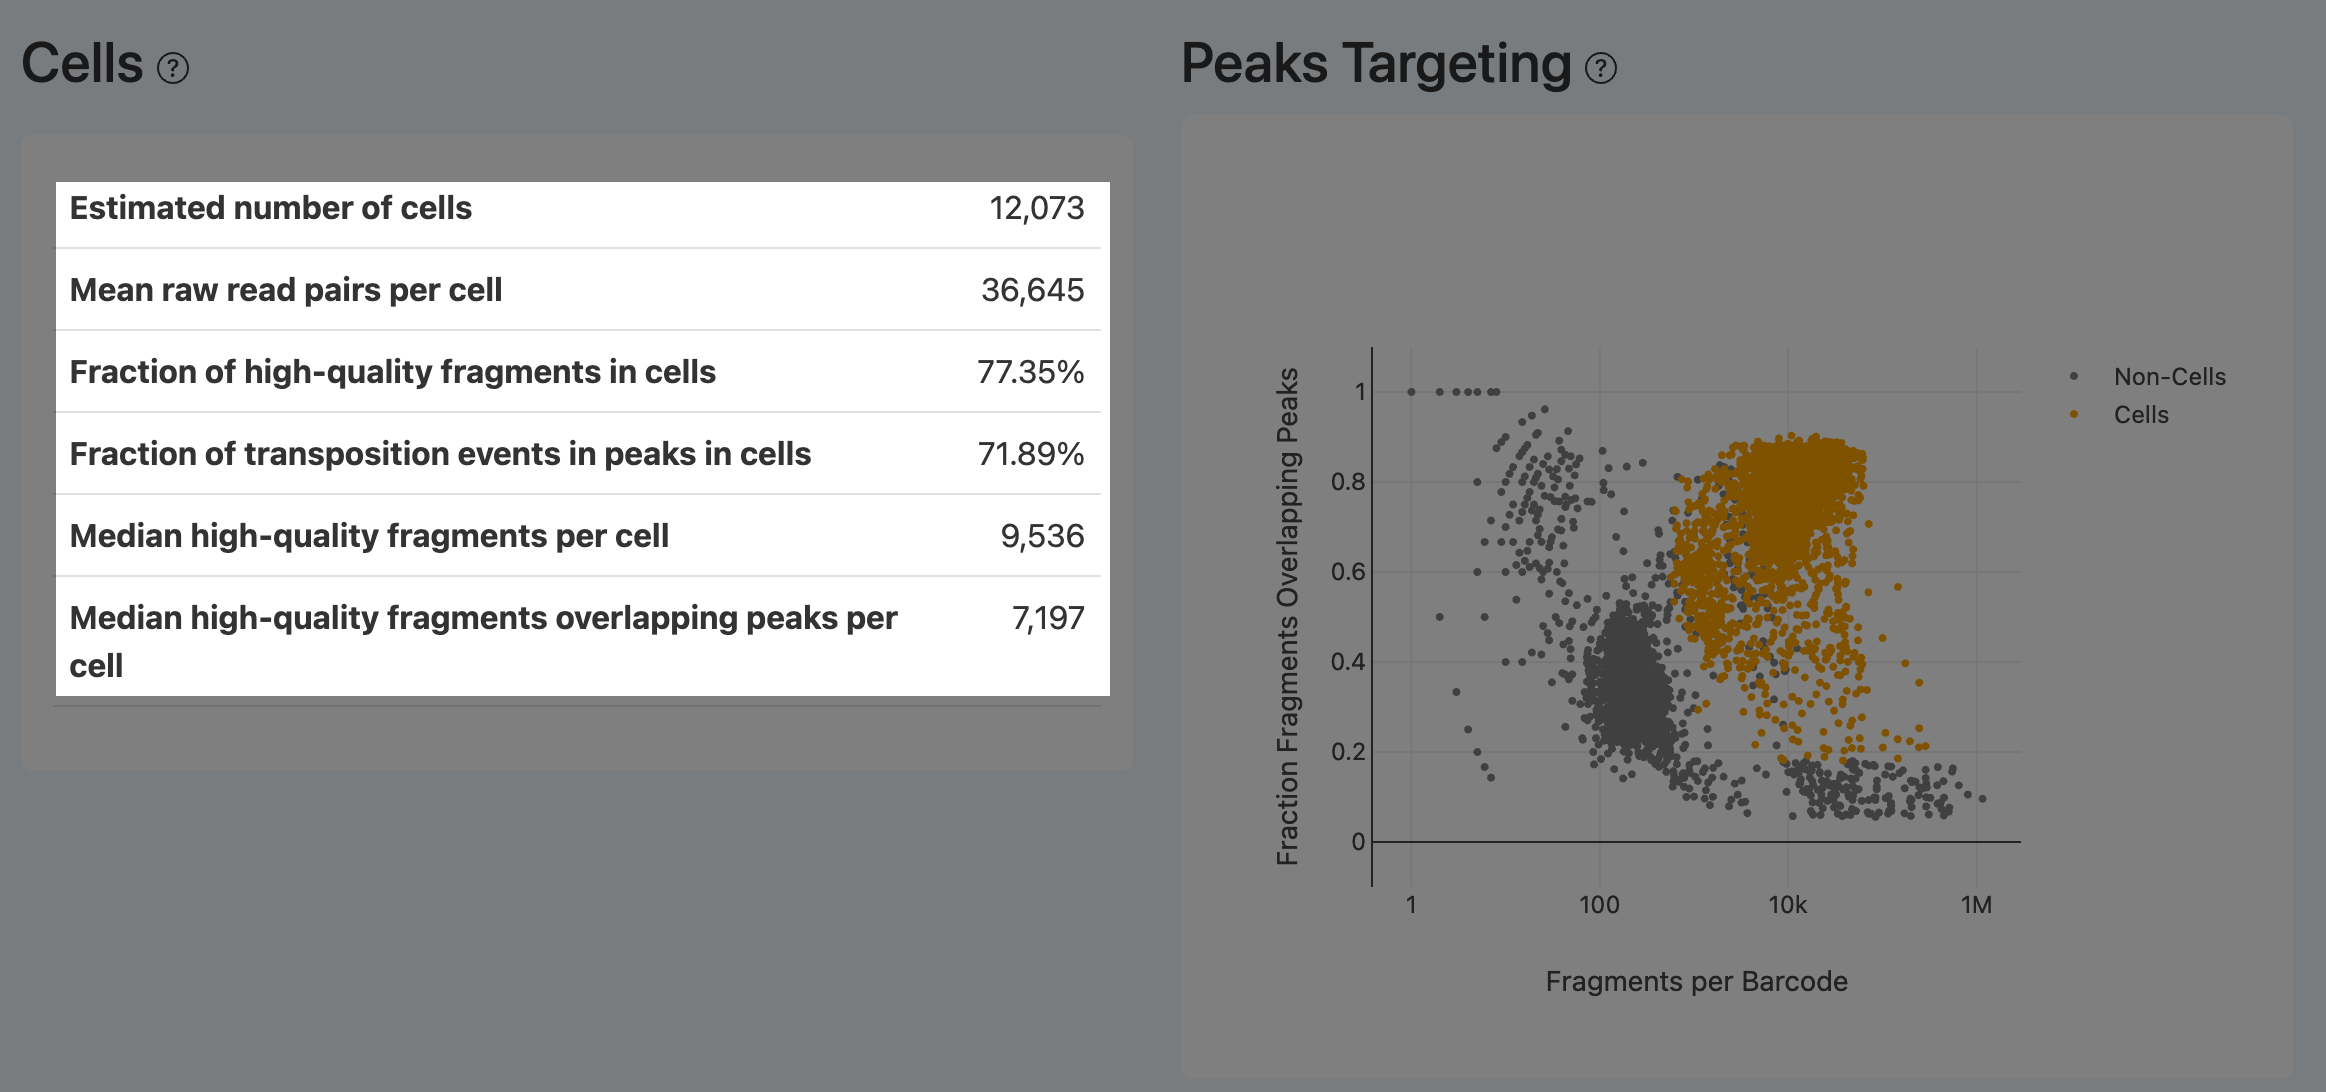
Peak Targeting Plot (ATAC)
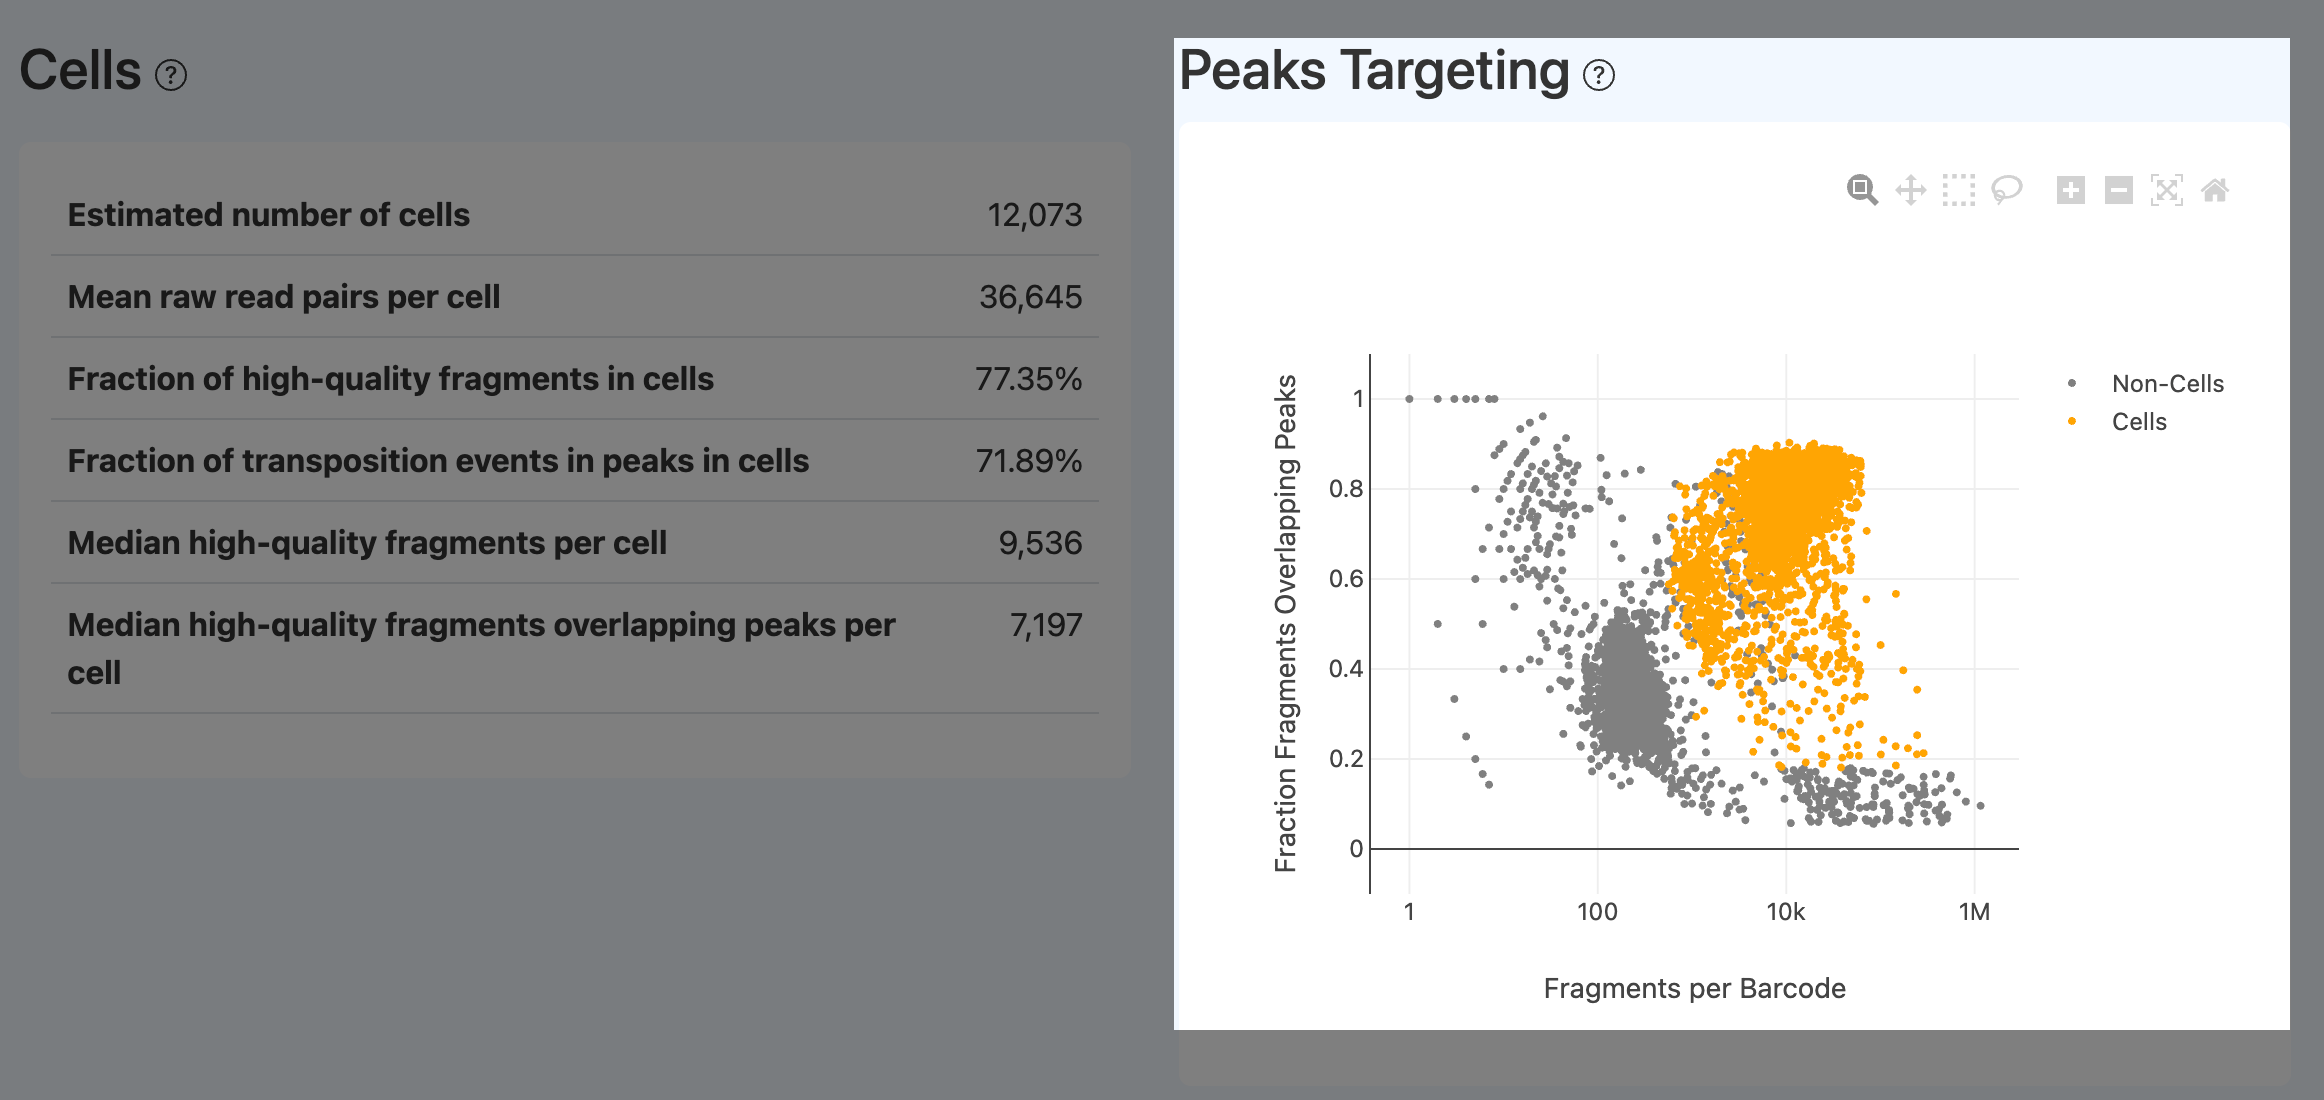
- Definition: Scatter plot with x-axis = fragments per barcode and y-axis = fraction overlapping peaks, annotated for cells vs non-cells.
- Computation: For each barcode, compute total fragments and peak-overlap fraction and plot.
- Interpretation:
- Cells should appear in the upper-right: many fragments and a high fraction overlapping peaks.
- Barcodes with many fragments but low peak overlap typically indicate loss of chromatin structure and dominant random cutting, often from dead/damaged cells. An ideal sample shows clear separation between cells and non-cells.
Targeting and TSS (ATAC)
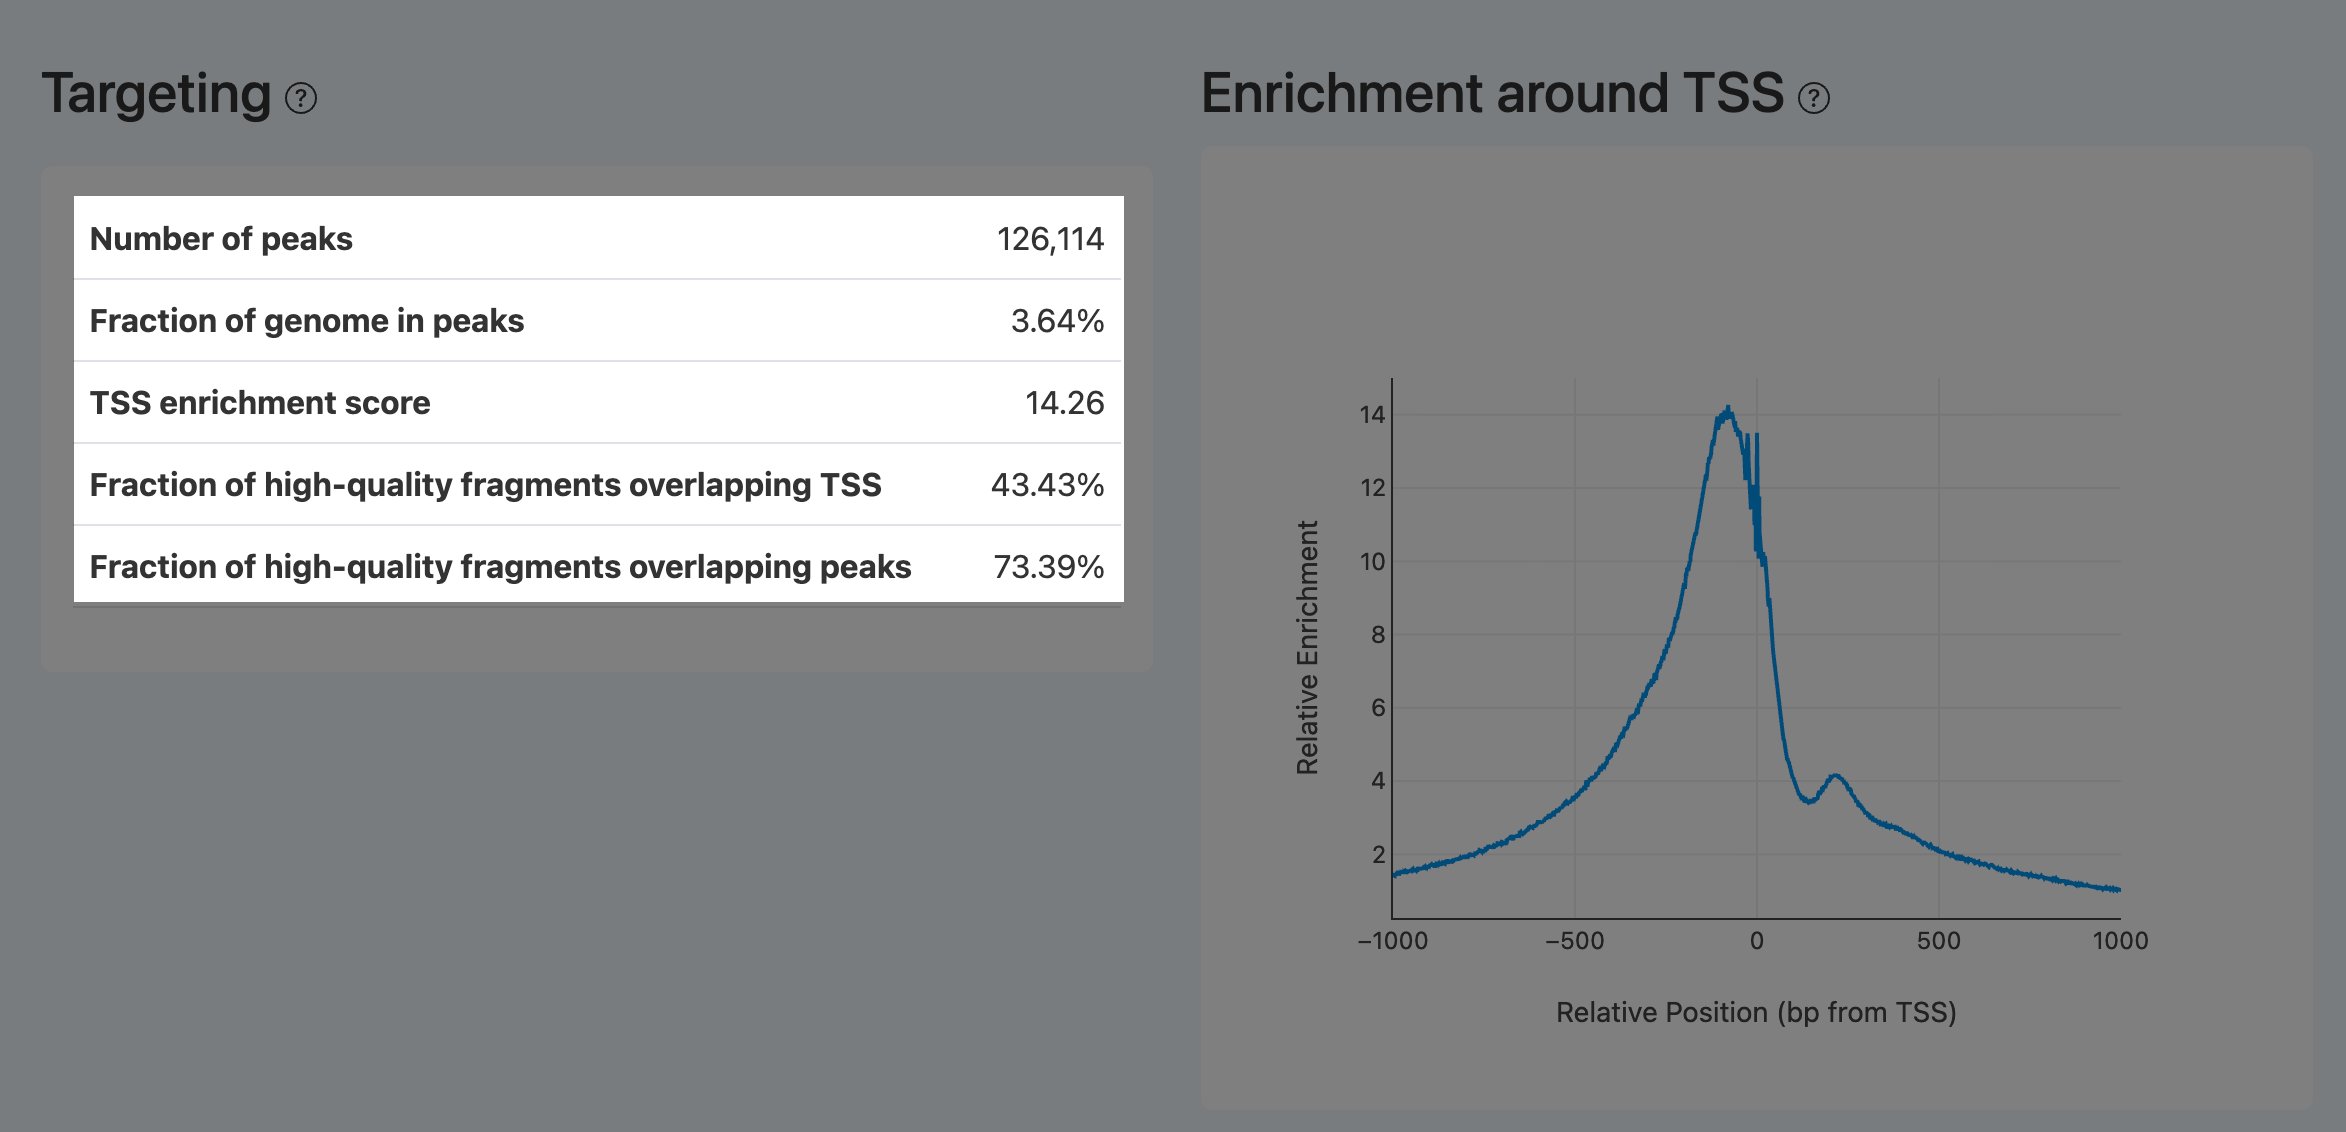
Number of peaks (ATAC)
- Definition: Total number of called ATAC peaks.
- Computation:
- Call peaks on deduplicated fragments using tools such as MACS3.
- Filter peaks on mitochondria and non-primary contigs; remove redundant/overlapping records as appropriate.
- Count remaining peaks.
- Interpretation:
- Depends on sample complexity, sequencing depth, and peak-calling parameters/thresholds.
- If very low, first check Median high-quality fragments per cell, Fraction of transposition events in peaks in cells, and TSS enrichment score.
Fraction of genome in peaks (ATAC)
- Definition: Fraction of the (primary) genome covered by peak intervals.
- Computation: Sum the lengths of all peak intervals and divide by total length of primary chromosomes.
- Interpretation:
- Measures the genomic “coverage breadth” of called peaks.
- Common guidance: not higher than 75%. Much higher values often indicate overly permissive peak calling (noise included) or widespread chromatin opening due to extensive cell death.
TSS enrichment score (ATAC)
Definition: Enrichment of ATAC cut sites around transcription start sites (TSS).
Computation:
- Window: ±1,000 bp around annotated TSS (2,000 bp total).
- Aggregate signal: count Tn5 cut sites at each base position.
- Normalize using the minimum signal within the window, and take the maximum of the curve as the TSS enrichment score.
Interpretation:
- A key metric for ATAC library quality and preservation of chromatin structure.
- For human/mouse, typically TSS enrichment score > 4 for fresh samples and > 3 for frozen samples is considered good; when < 3, it is often associated with dead cells, nuclear membrane rupture, or suboptimal Tn5 conditions, and can also arise from reference/TSS annotation mismatches.
Fraction of high-quality fragments overlapping TSS (ATAC)
- Definition: Fraction of high-quality fragments that overlap TSS regions.
- Computation: Overlap high-quality fragments with TSS intervals and divide by total high-quality fragments.
- Interpretation: Confirms whether usable fragments are enriched at TSS. Recommended not less than 15%.
Fraction of High-Quality Fragments Overlapping Peaks (ATAC)
- Definition: Fraction of high-quality fragments that overlap called peaks.
- Computation: Overlap high-quality fragments with peak intervals and divide by total high-quality fragments.
- Interpretation:
- Confirms whether usable fragments concentrate within peaks. Recommended > 20%.
- Complements TSS enrichment score and Fraction of transposition events in peaks in cells to assess whether high-quality fragments fall into functional regulatory regions.
- If multiple metrics are jointly low, ATAC signal often lacks structured enrichment and may not support reliable regulatory inference.
Enrichment around TSS (ATAC)
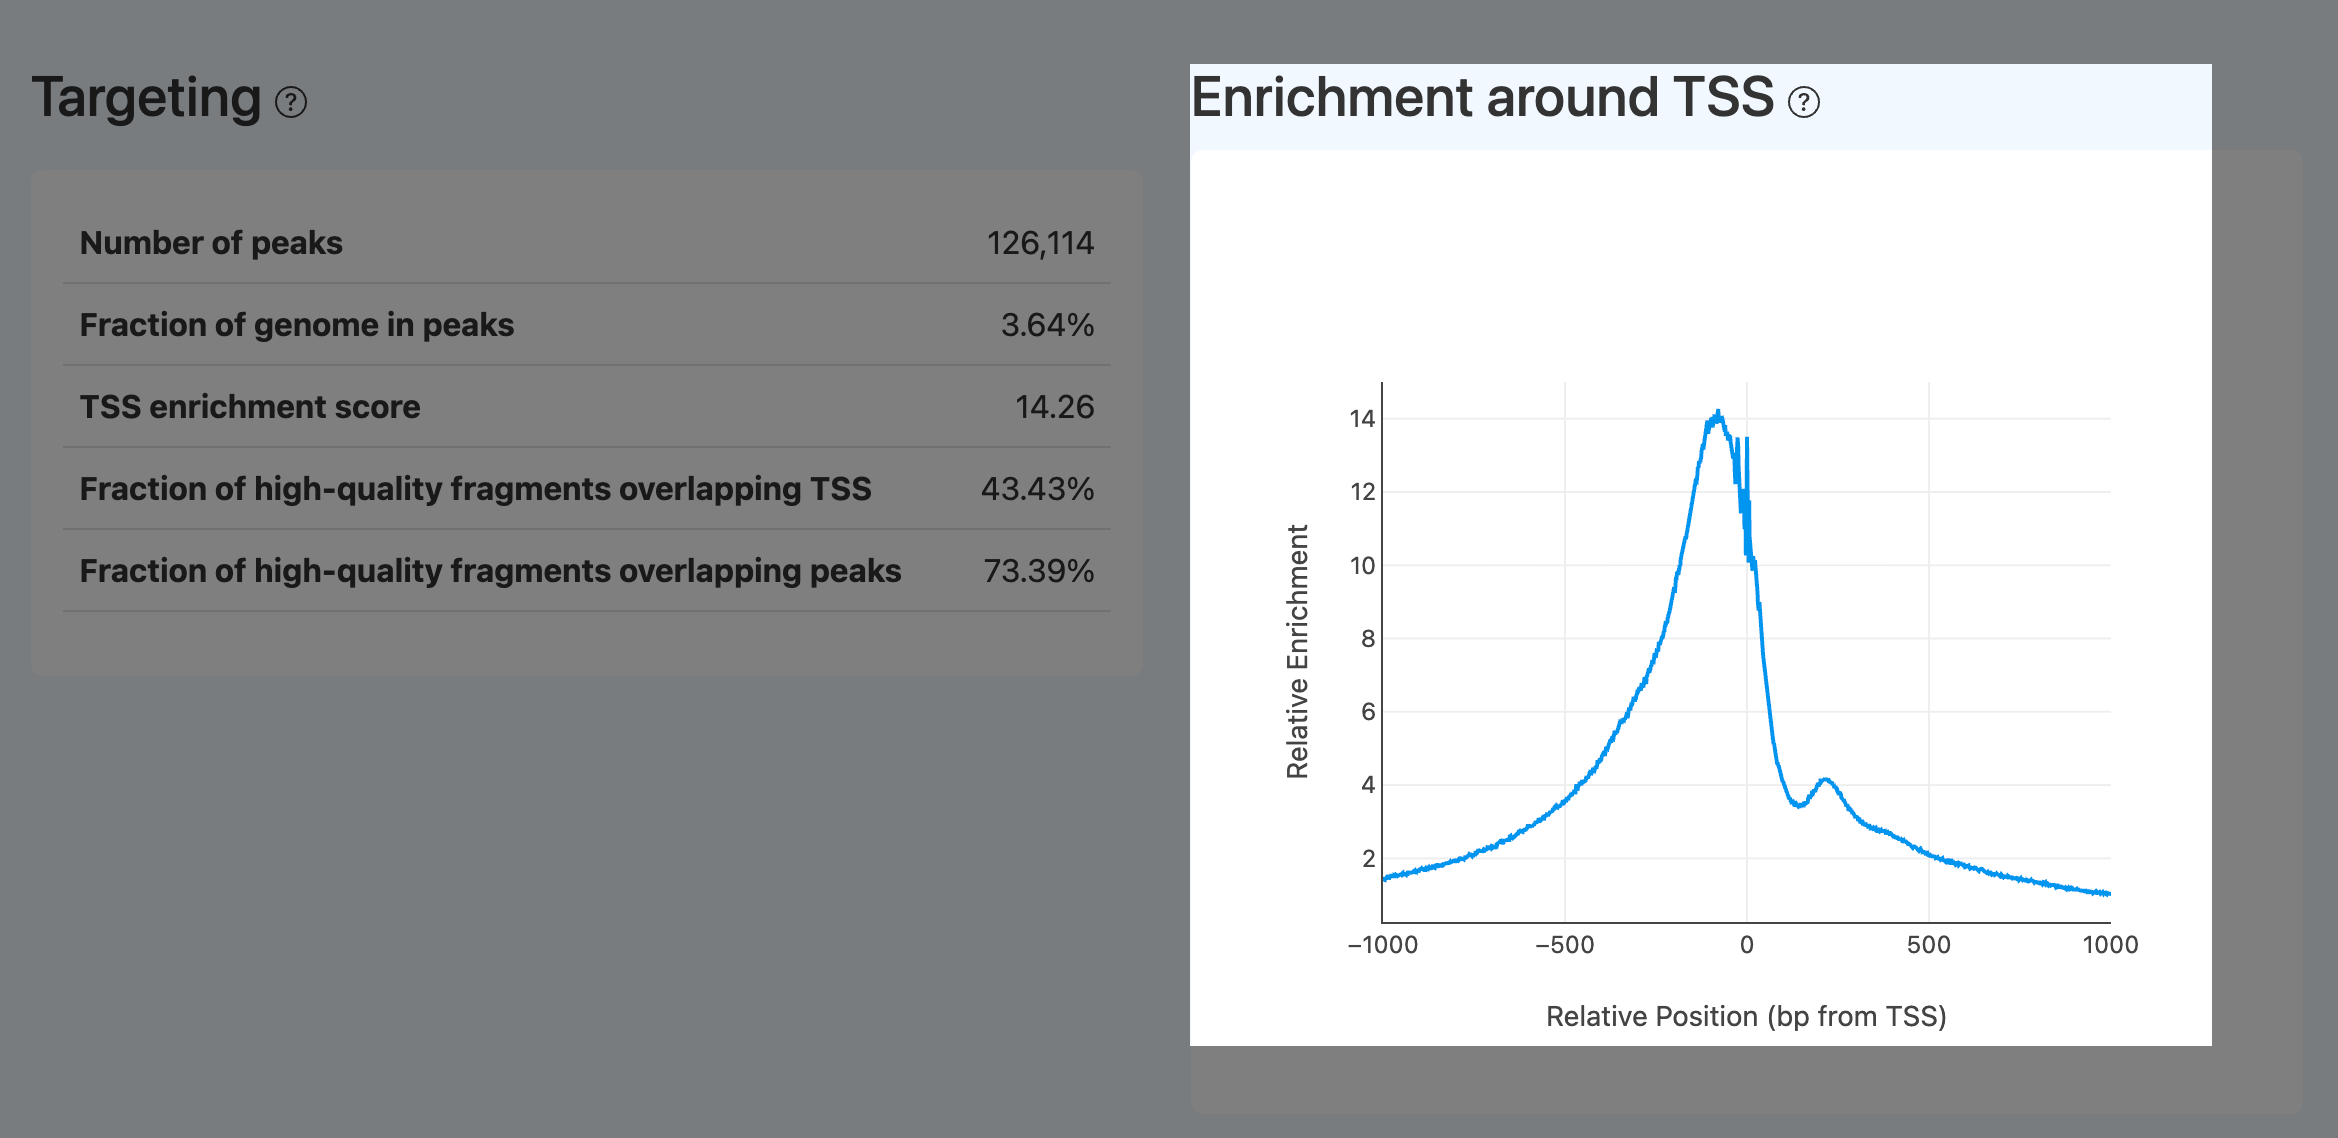
- Definition: Aggregated cut-site signal curve around all annotated TSS (typically ±1,000 bp), serving as the visual counterpart of TSS enrichment score.
- Computation: Same aggregation/normalization procedure as TSS enrichment score, visualized as a curve across the window.
- Interpretation:
- A successful library shows a prominent central spike, often with a right-side shoulder (+1 nucleosome), and smooth decay on both sides. The peak height corresponds to TSS enrichment score.
- Abnormal patterns:
- pronounced shift of the central peak from 0: often TSS annotation/reference mismatch;
- noisy/jagged curve: often low effective events/information content;
- flat curve or weak central enrichment: high random background cutting, disrupted nuclei/chromatin, or suboptimal library conditions; interpret with Fraction of transposition events in peaks in cells, targeting, and non-nuclear/duplicate metrics.
Mapping (ATAC)
Confidently Mapped Read Pairs (ATAC)
- Definition: Fraction of read pairs mapped to the nuclear genome with high confidence.
- Computation: Confidently mapped read pairs = Q30MappedPaired / Total (counting only properly paired alignments with MAPQ ≥ 30).
- Interpretation:
- Common recommendation: Confidently mapped read pairs ≥ 70%.
- If low, check reference genome/species and index construction, contamination (microbial/mixed samples), and read quality (Q30, N content).
Unmapped Read Pairs (ATAC)
- Definition: Fraction of read pairs that are not successfully mapped as proper pairs to the reference genome.
- Computation: Unmapped read pairs = 1 − (MappedPaired / Total).
- Interpretation: High values often indicate reference mismatch, low-complexity/adapters, or poor read quality.
Non-nuclear Read Pairs (ATAC)
- Definition: Fraction of read pairs mapped to non-nuclear regions (e.g., mitochondria).
- Computation: non-nuclear pairs / all mapped pairs.
- Interpretation: High values often indicate cell lysis/death or poor nuclei preparation, frequently accompanied by decreased TSS enrichment score and a degraded Peak targeting plot.
Fragmentation (ATAC)
Insert Size Distribution (ATAC)
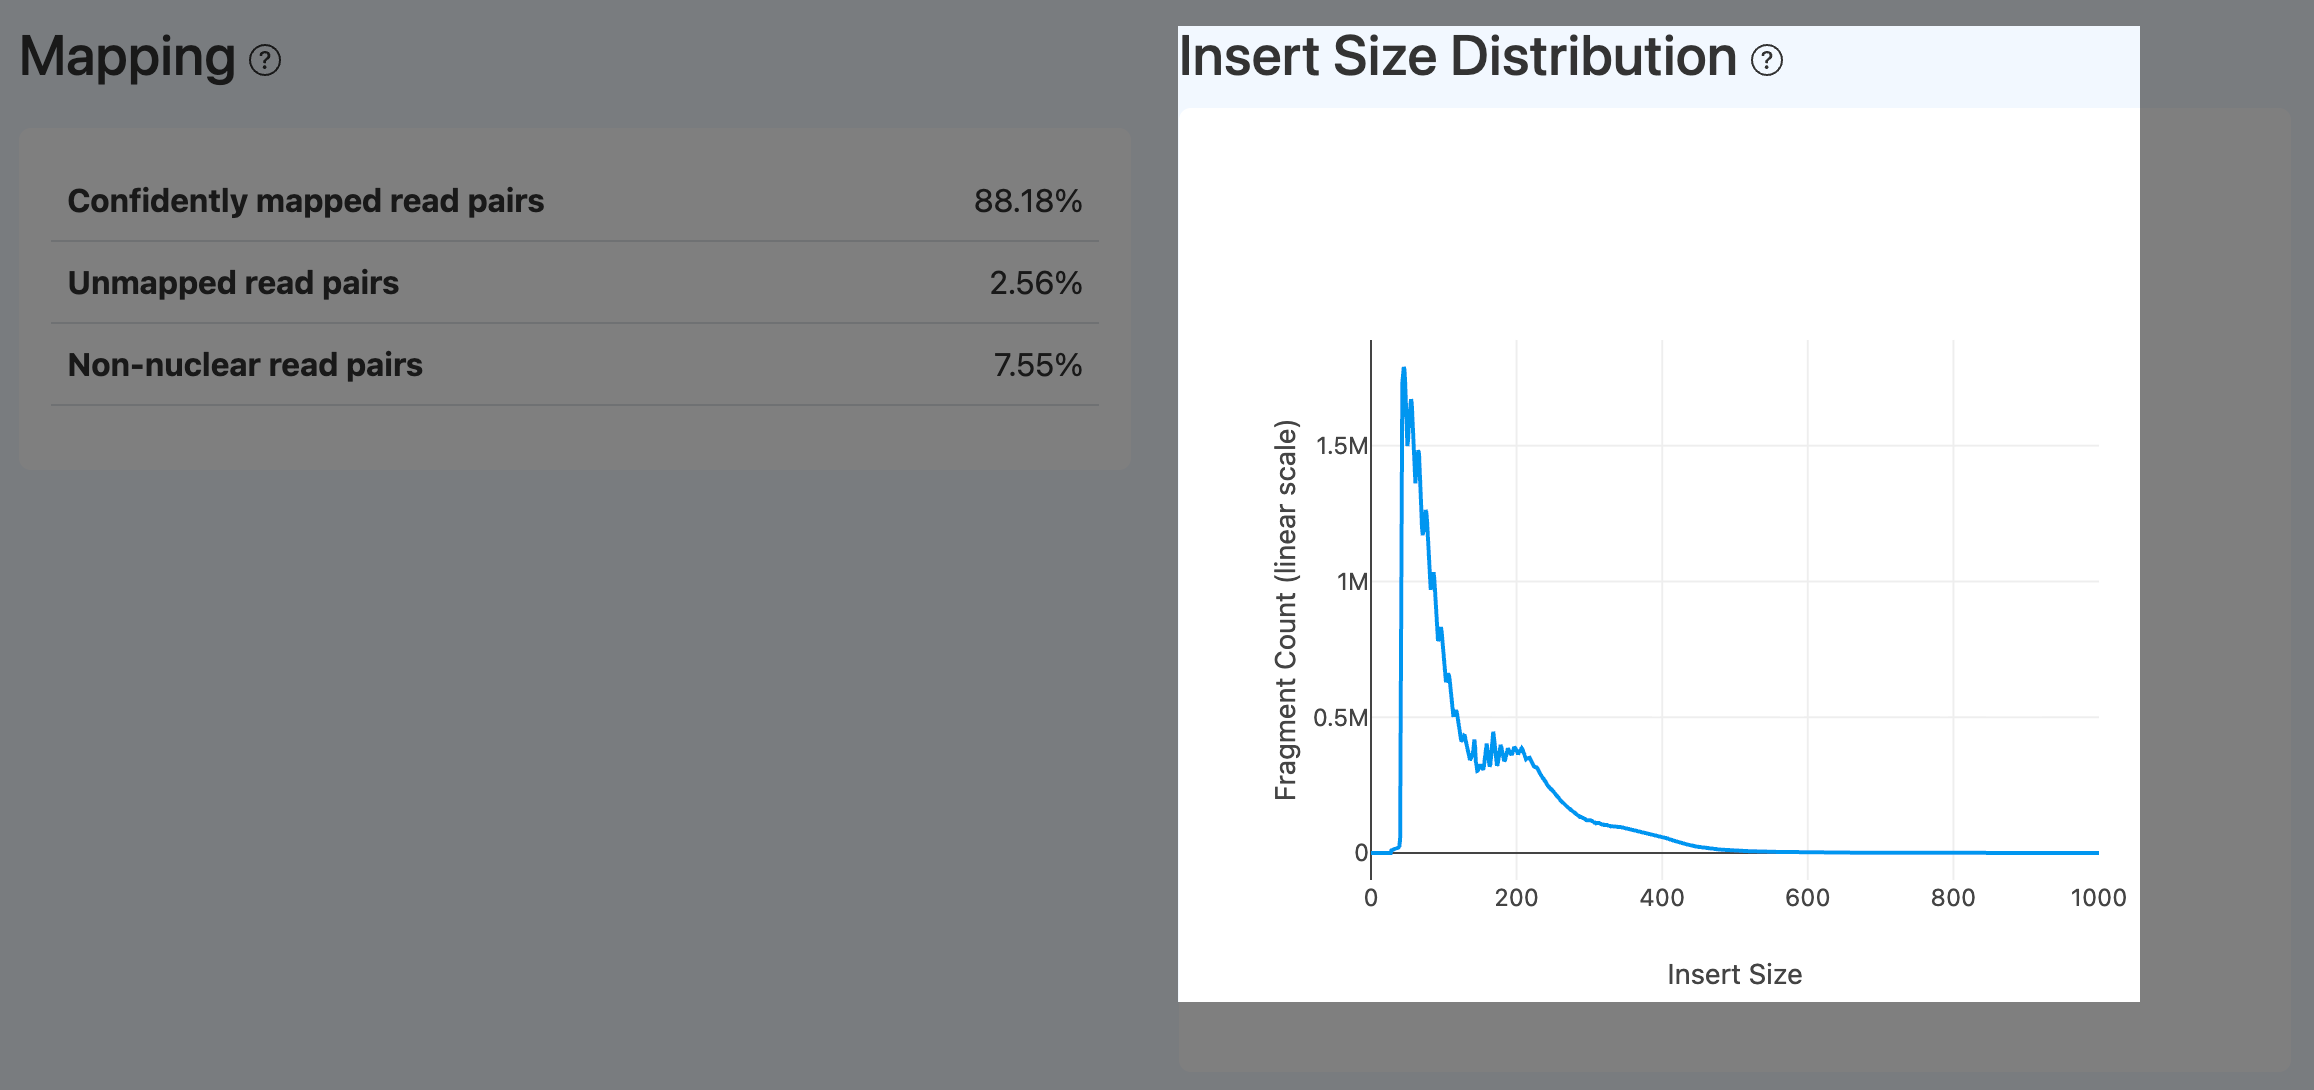
- Definition: Distribution of ATAC fragment insert sizes, showing nucleosome-free, mono-nucleosome, and multi-nucleosome patterns.
- Computation: Compute insert size per fragment from alignments and plot a histogram/smoothed curve.
- Interpretation:
- In a high-quality ATAC library, a strong peak < 200 bp (open chromatin + nucleosome-free) is expected, followed by decaying mono/di-nucleosome peaks (~200–600 bp) and ~10.5 bp periodicity.
- A smooth curve without clear peaks or an abnormal single-peak pattern often indicates disrupted chromatin structure or abnormal fragmentation (e.g., over-digestion or loss of longer fragments).